Reframing Analytics Around User Decisions
I led the redesign across desktop and mobile, turning a fragmented reporting experience into a clearer, scalable analytics system that could work across products and verticals.
Loading case study…
I led the redesign of the Analytics module, a platform feature across multiple products and verticals, resulting in a significant increase in key business metrics.
I led the redesign across desktop and mobile, turning a fragmented reporting experience into a clearer, scalable analytics system that could work across products and verticals.
32%
Monthly active users
Monthly active users for Analytics increased 32% within three months of launch.
24%
Report exports
Analytics report exports increased 24% within three months of launch.
87
Satisfaction score
A post-launch survey of 65 users produced an 87 satisfaction score.
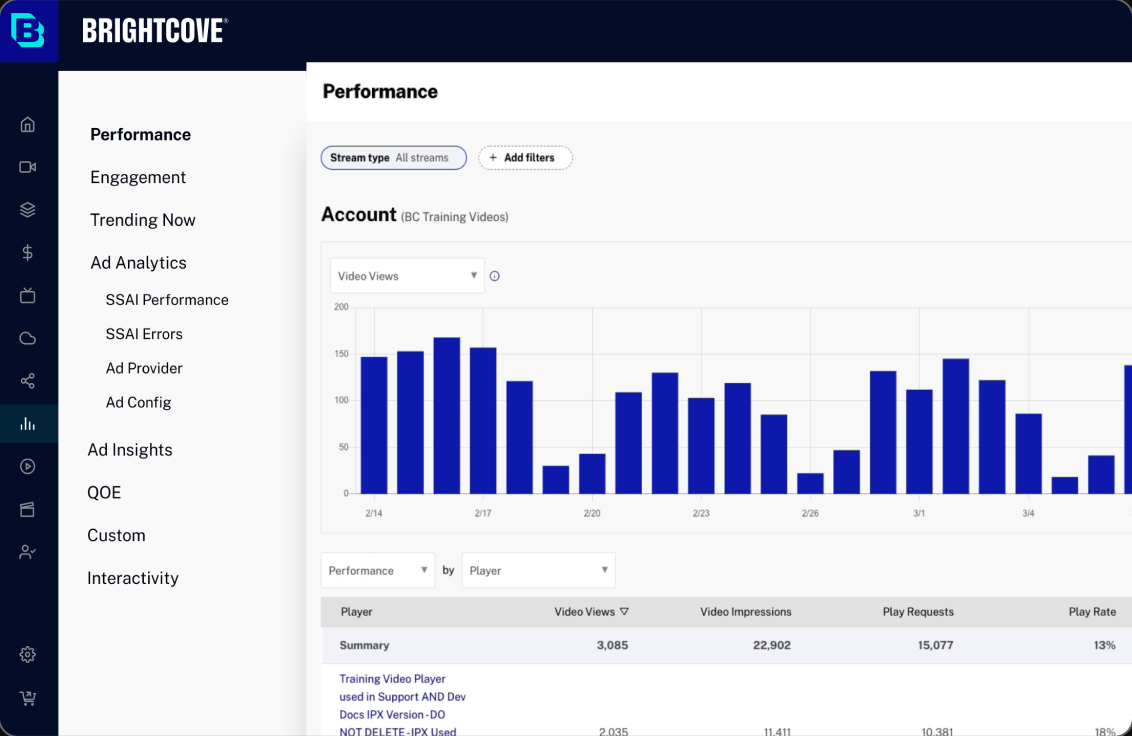
Analytics served more than 10K users across marketing, video streaming, and corporate communication. Yet fewer than 25% of monthly active users engaged with it, and 27% of churned customers cited Analytics as a reason for leaving. Interviews showed the root issue: one generic structure was forcing very different roles to hunt for very different metrics.
Analytics served more than 10K users across marketing, video streaming, and corporate communication. Yet fewer than 25% of monthly active users engaged with it, and 27% of churned customers cited Analytics as a reason for leaving. Interviews showed the root issue: one generic structure was forcing very different roles to hunt for very different metrics.
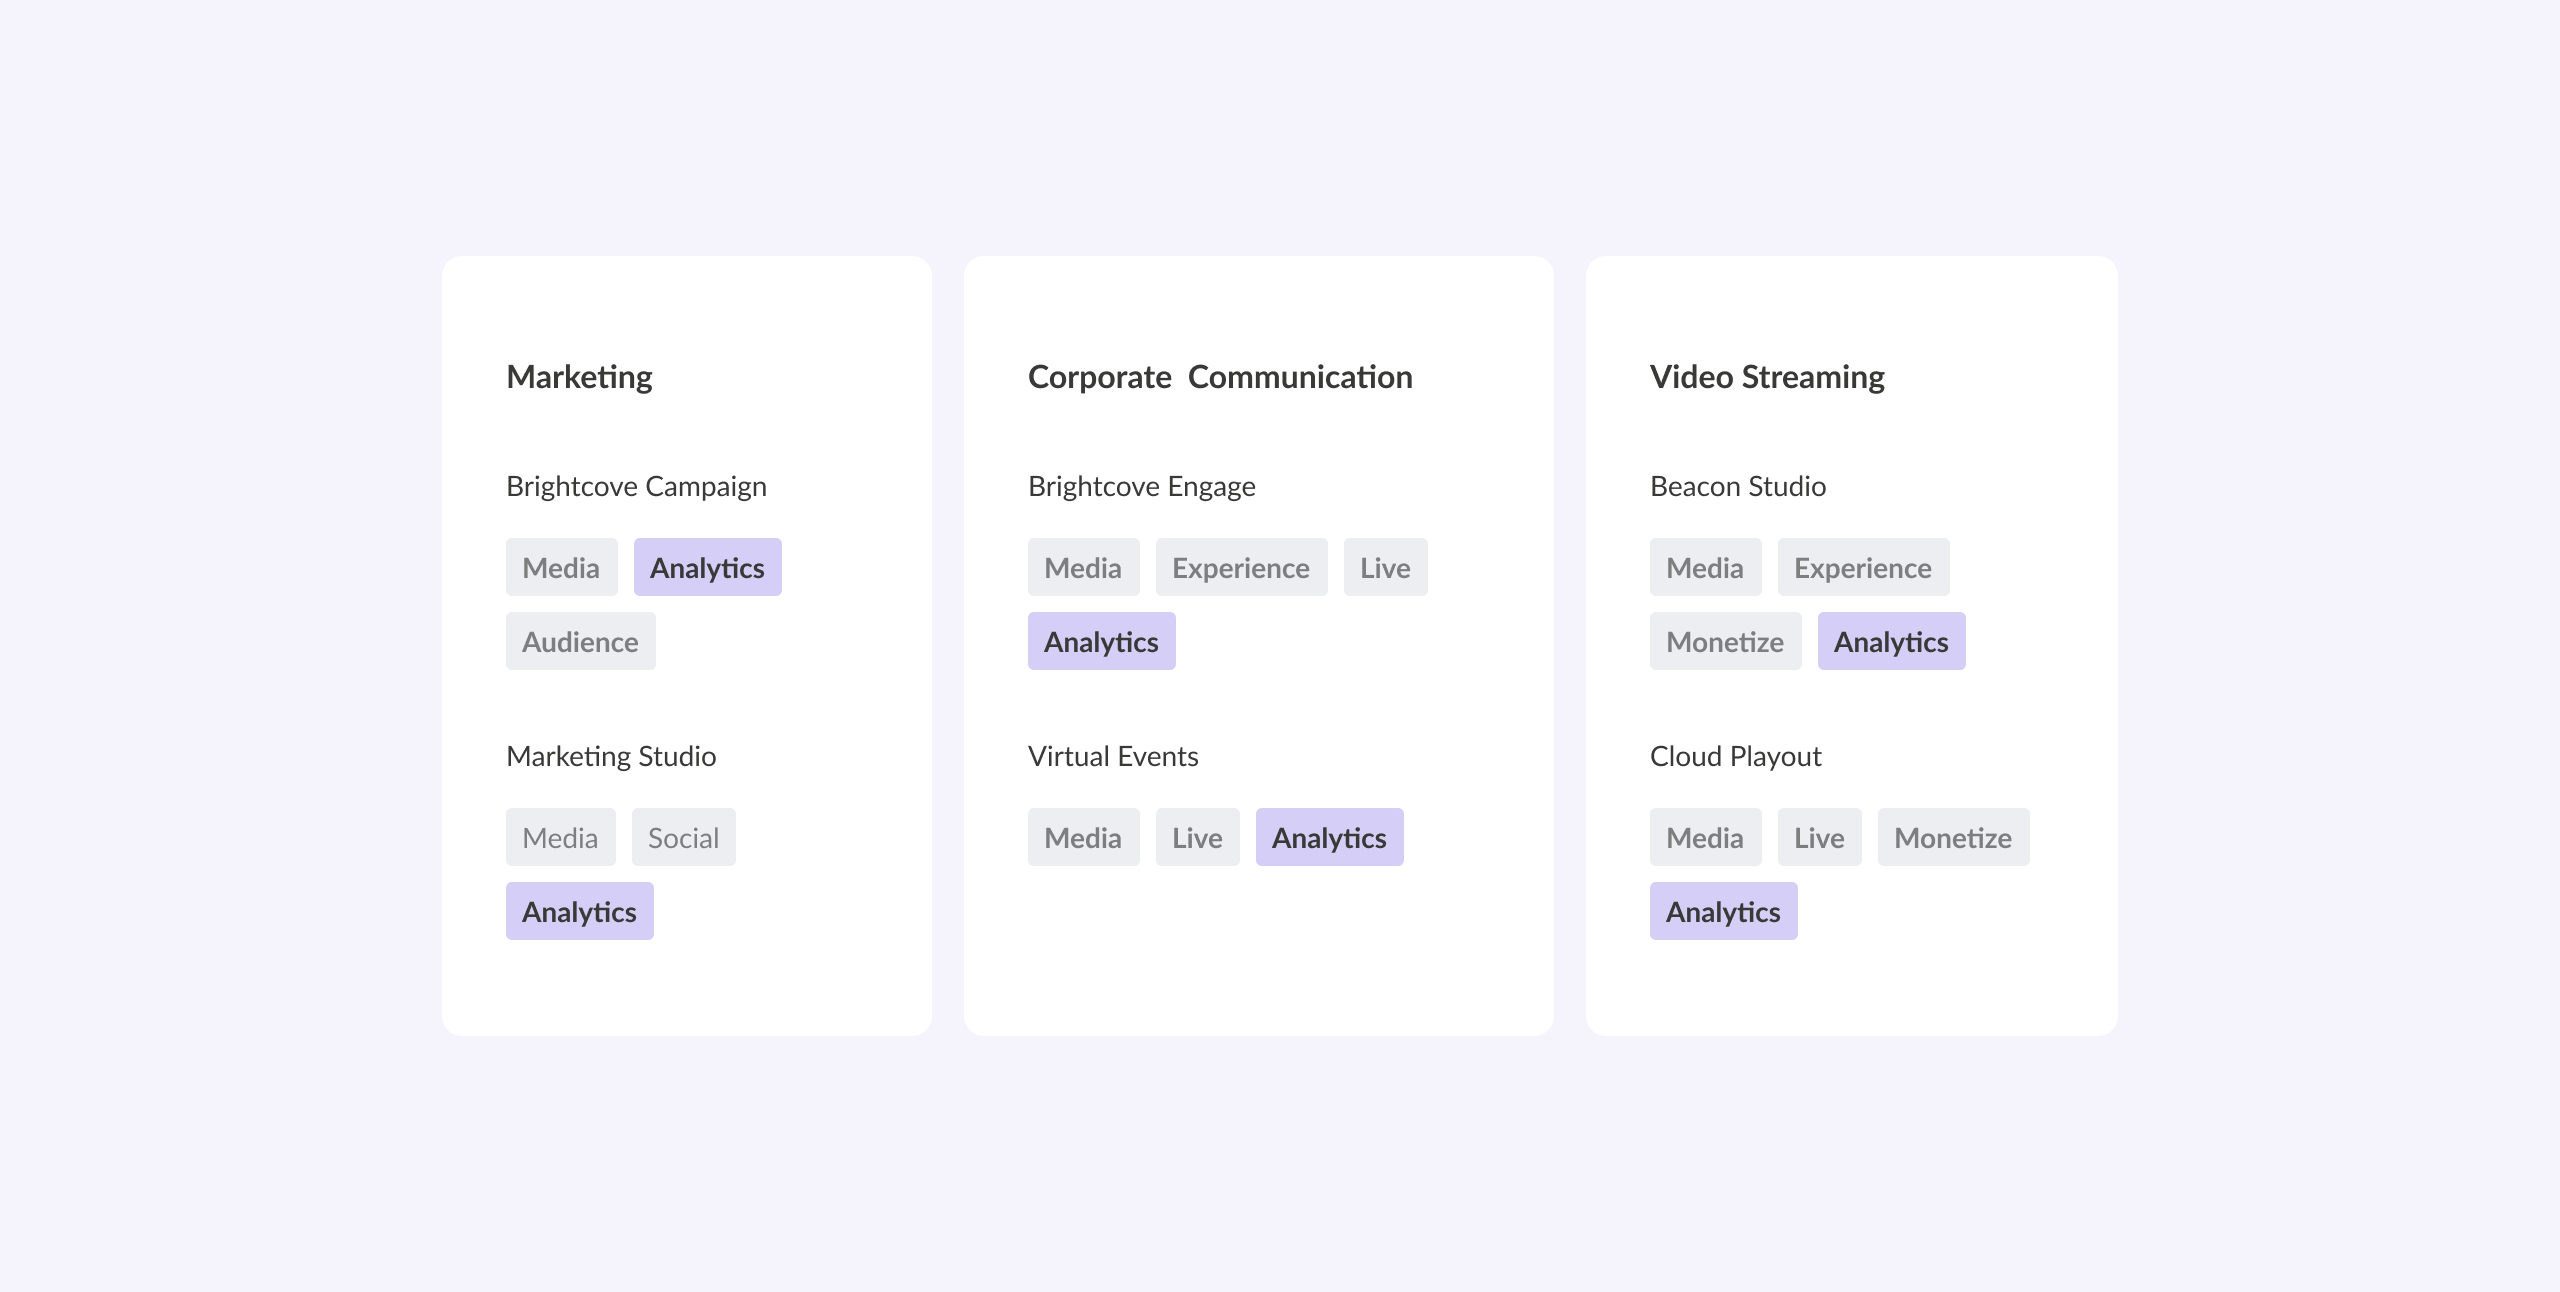
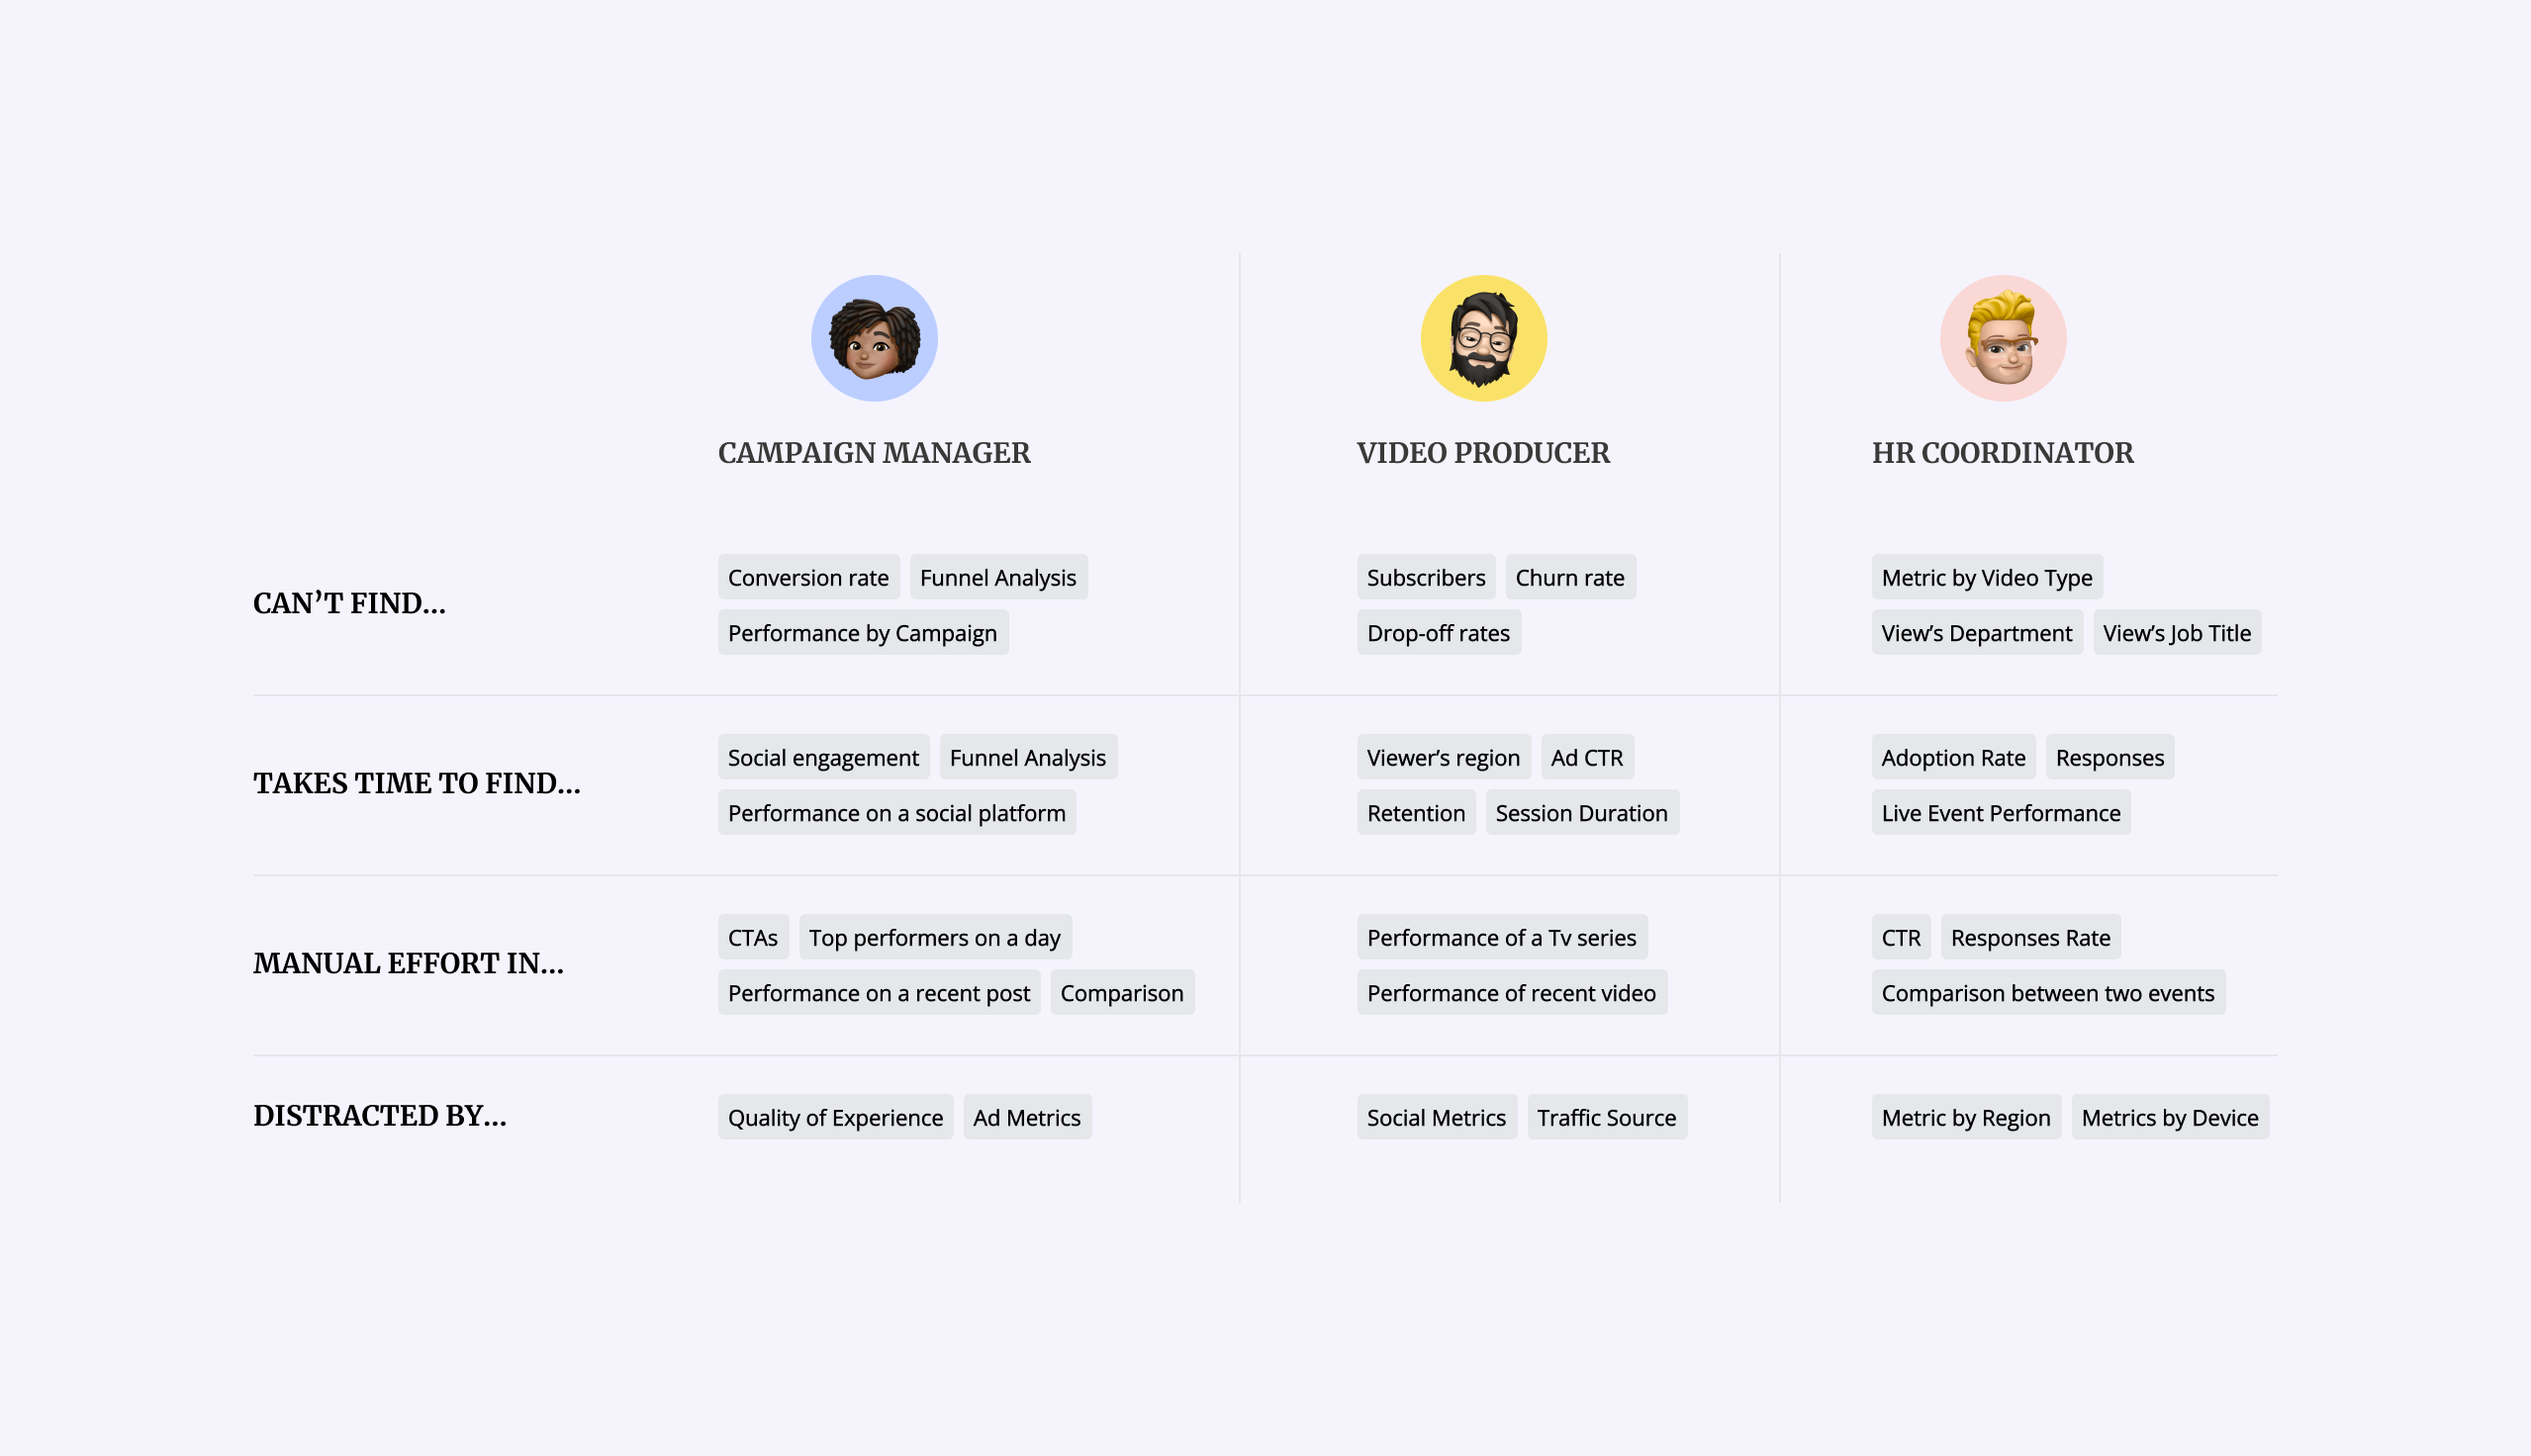
With the PM, I used OKRs to translate a broad engagement problem into measurable outcomes, three value propositions, and three UX goals the team could design and test against.
With the PM, I used OKRs to translate a broad engagement problem into measurable outcomes, three value propositions, and three UX goals the team could design and test against.
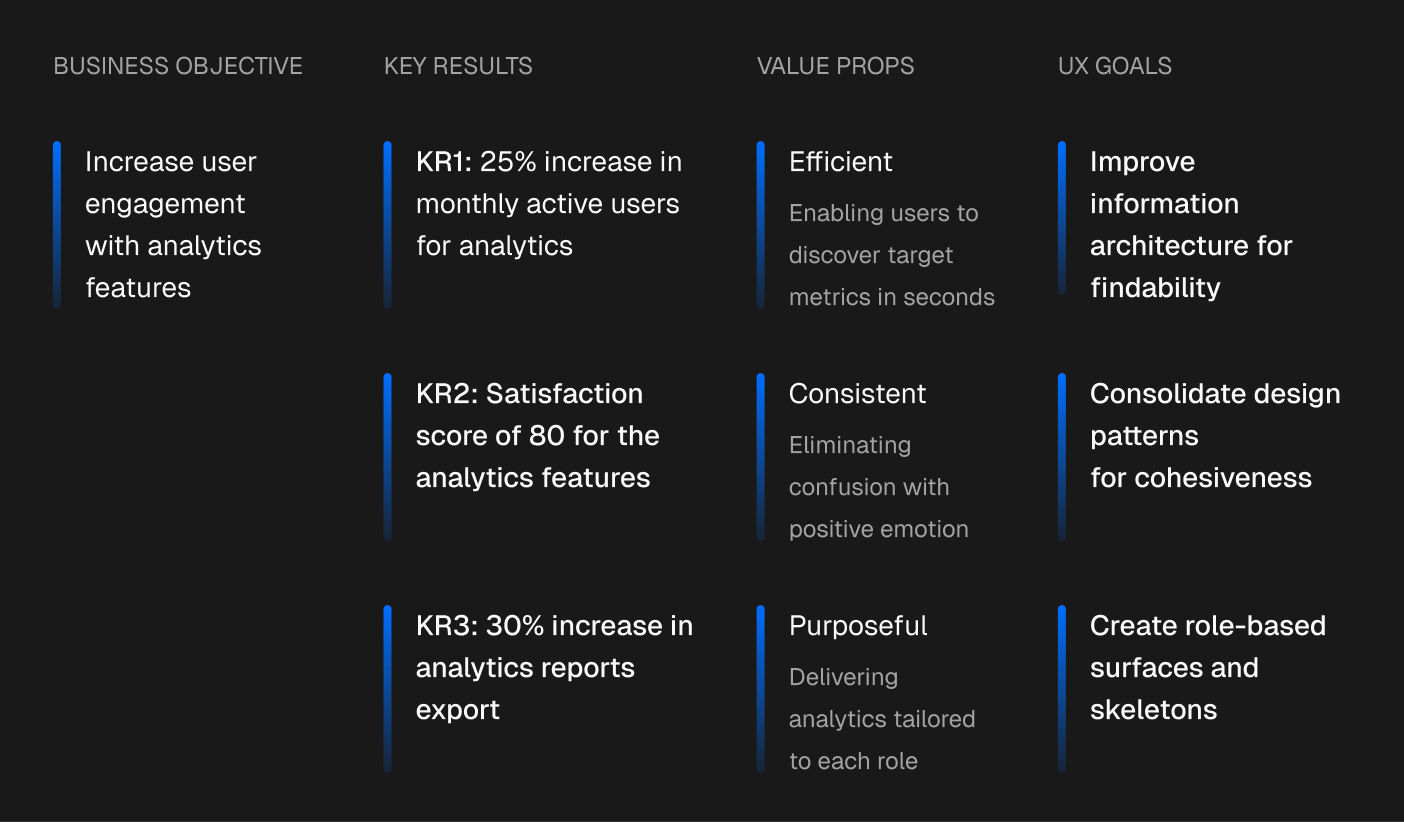
With the PM, I used OKRs to translate a broad engagement problem into measurable outcomes, three value propositions, and three UX goals the team could design and test against.
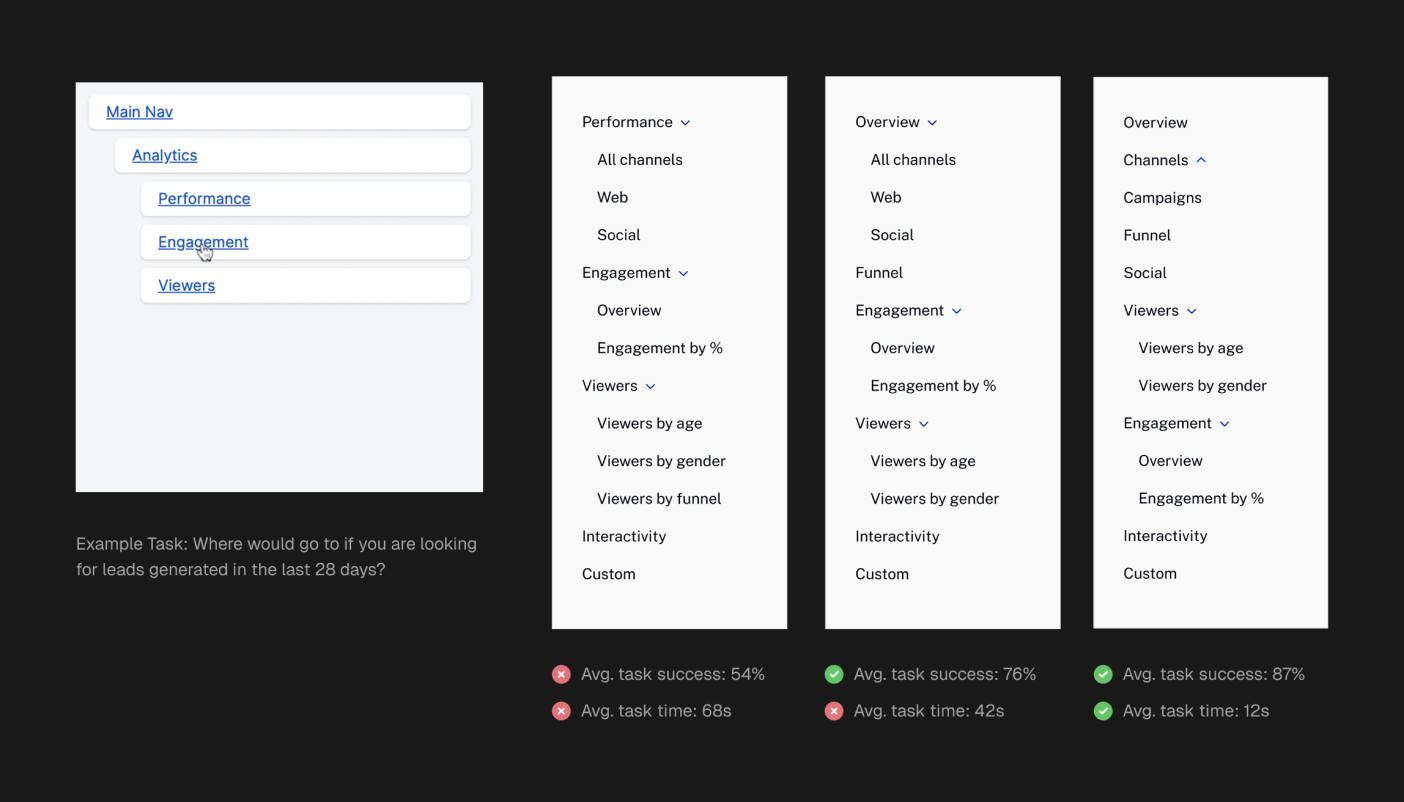
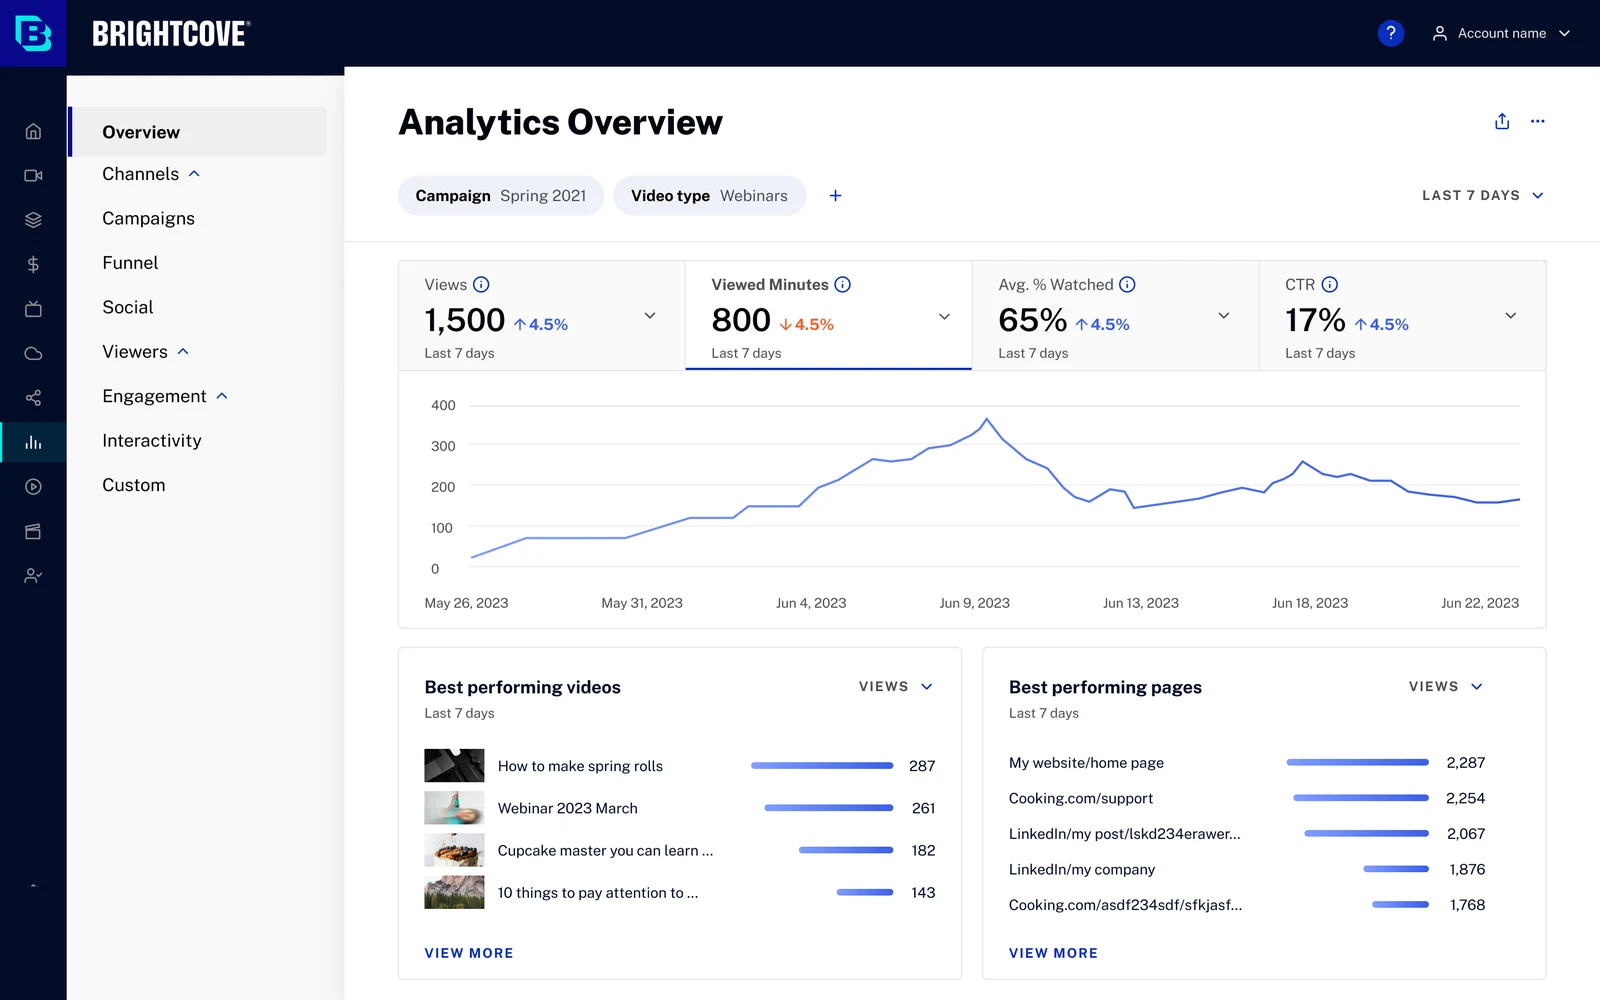
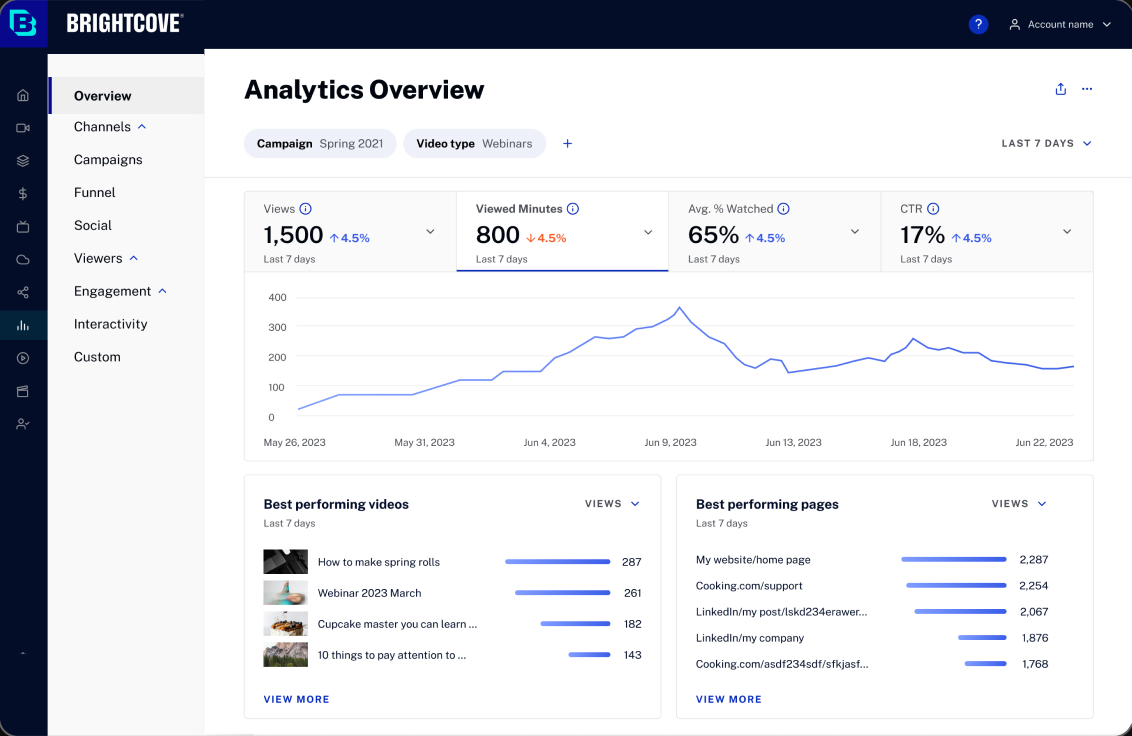
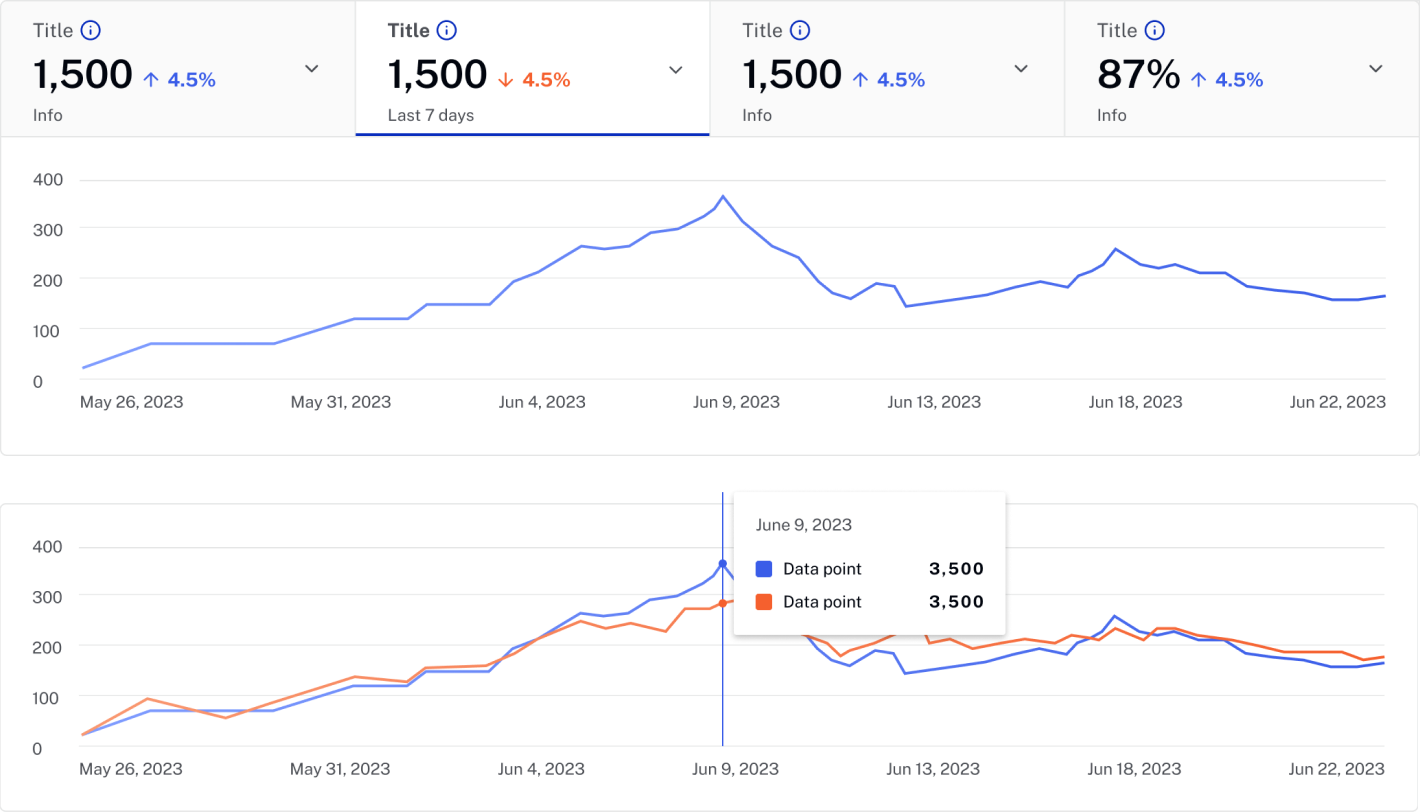
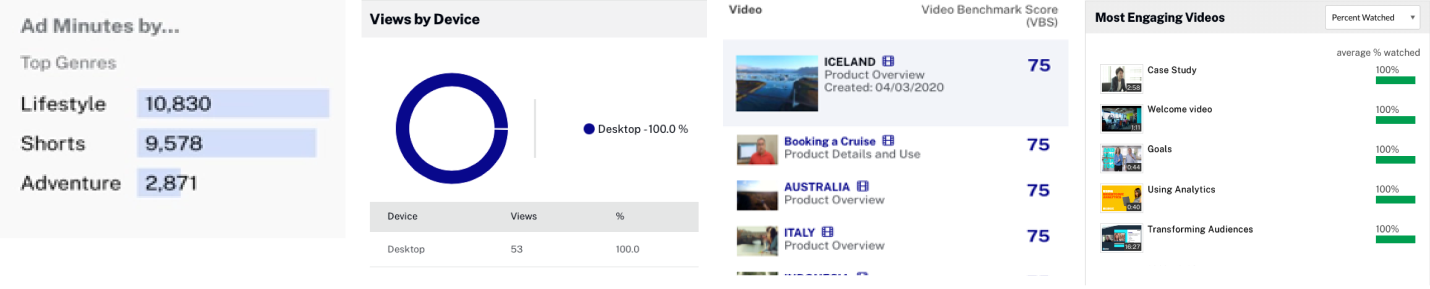
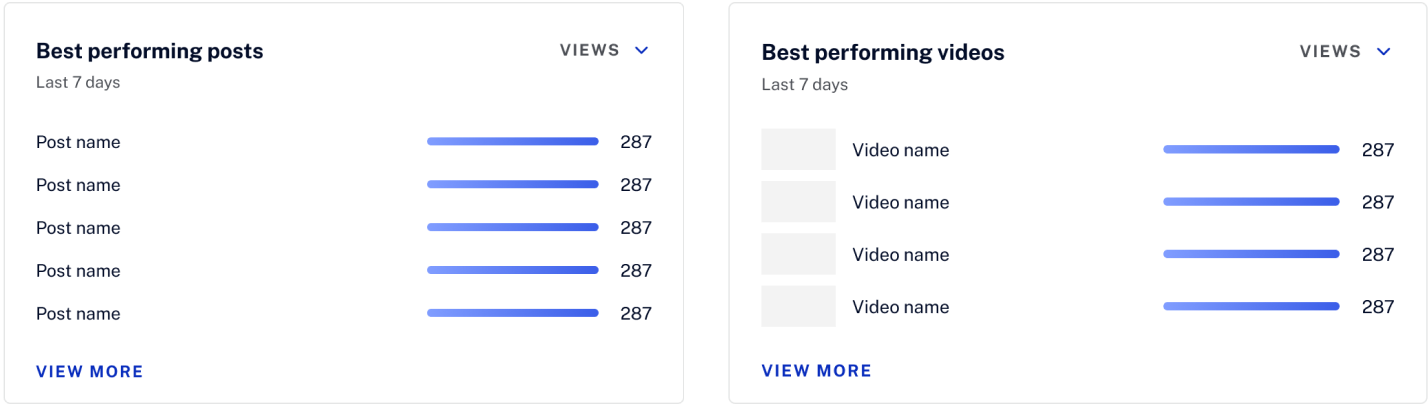
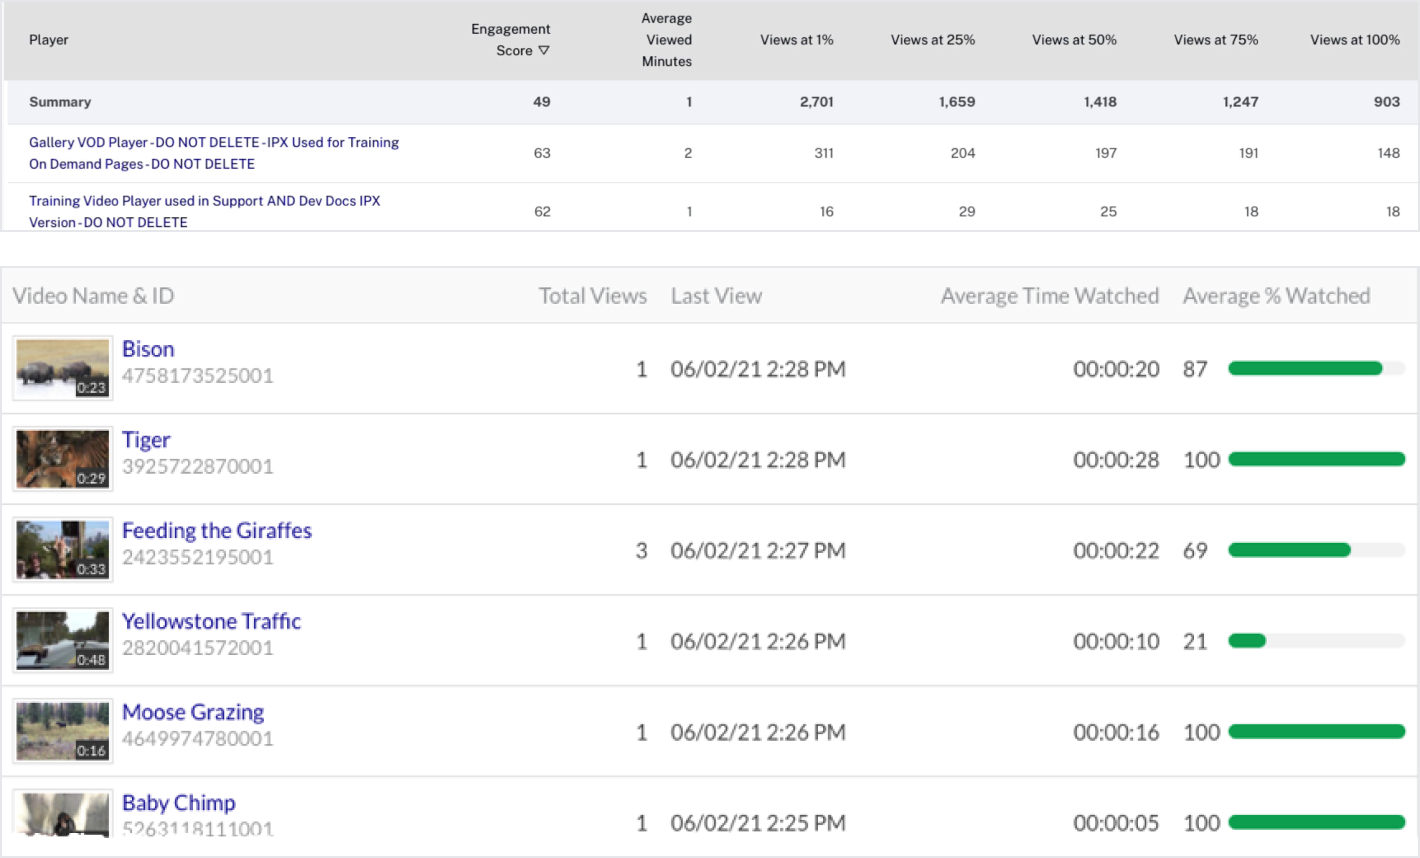
I audited the existing Analytics UI and found 17 different design patterns solving overlapping problems. I consolidated them into three reusable patterns—Hero Graphs, Highlight Cards, and Data Tables—reducing cognitive load for users and maintenance cost for engineering.
Displaying critical metrics at the top of the page, associated with a line chart or bar chart to depict changes over the past period.
Displaying critical metrics at the top of the page, associated with a line chart or bar chart to depict changes over the past period.
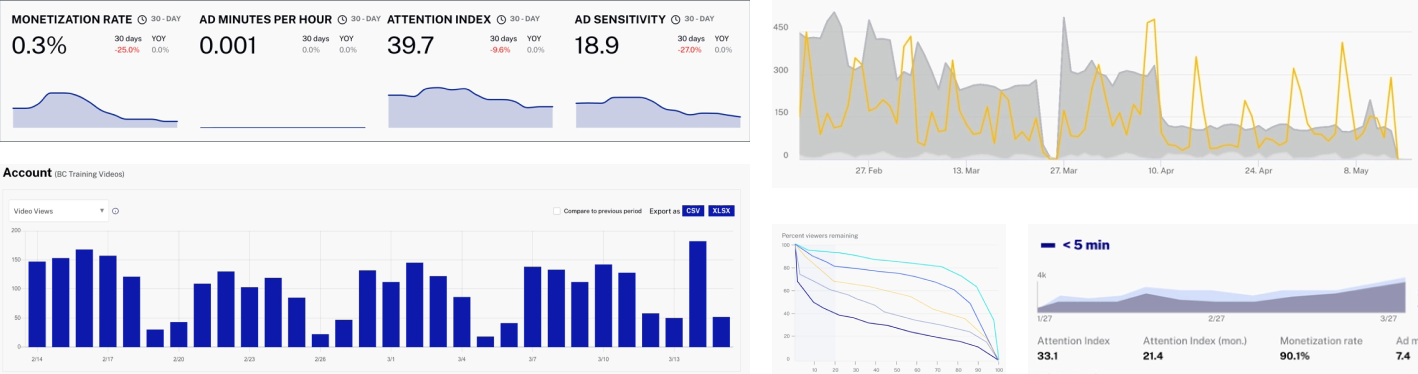
Displaying highlights across a single metric coupled with a dimension (e.g., top 3 videos by views), users can drill down for details.
Displaying granular data across a dimension and multiple metrics, users can drill down to a single unit for detailed insights.
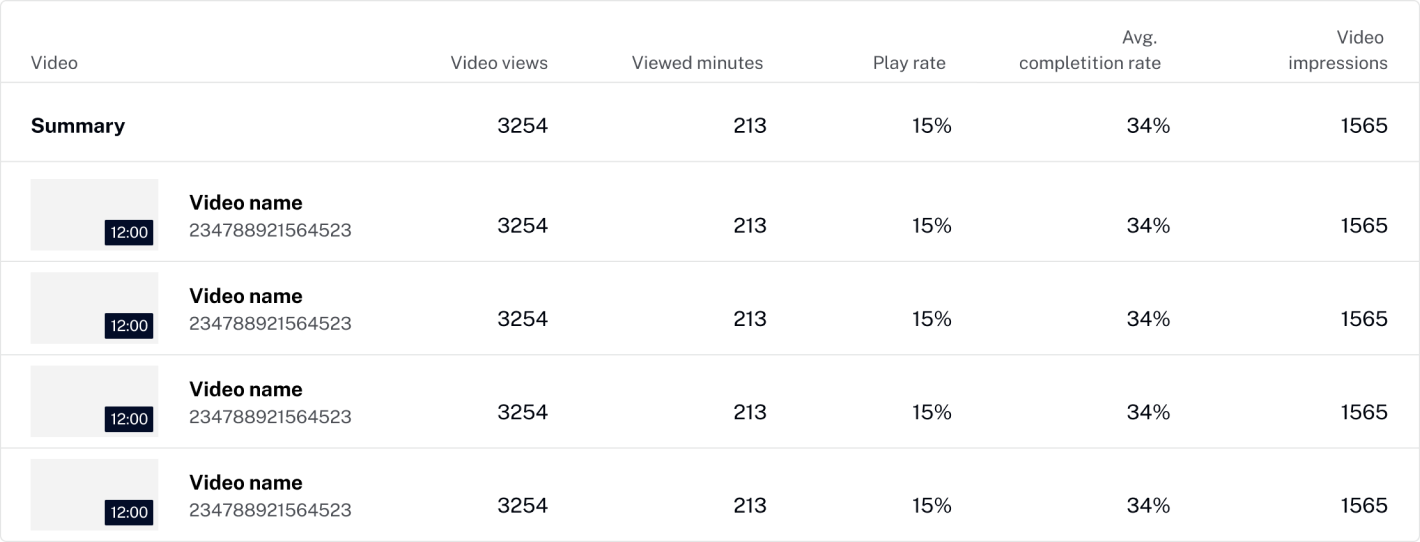
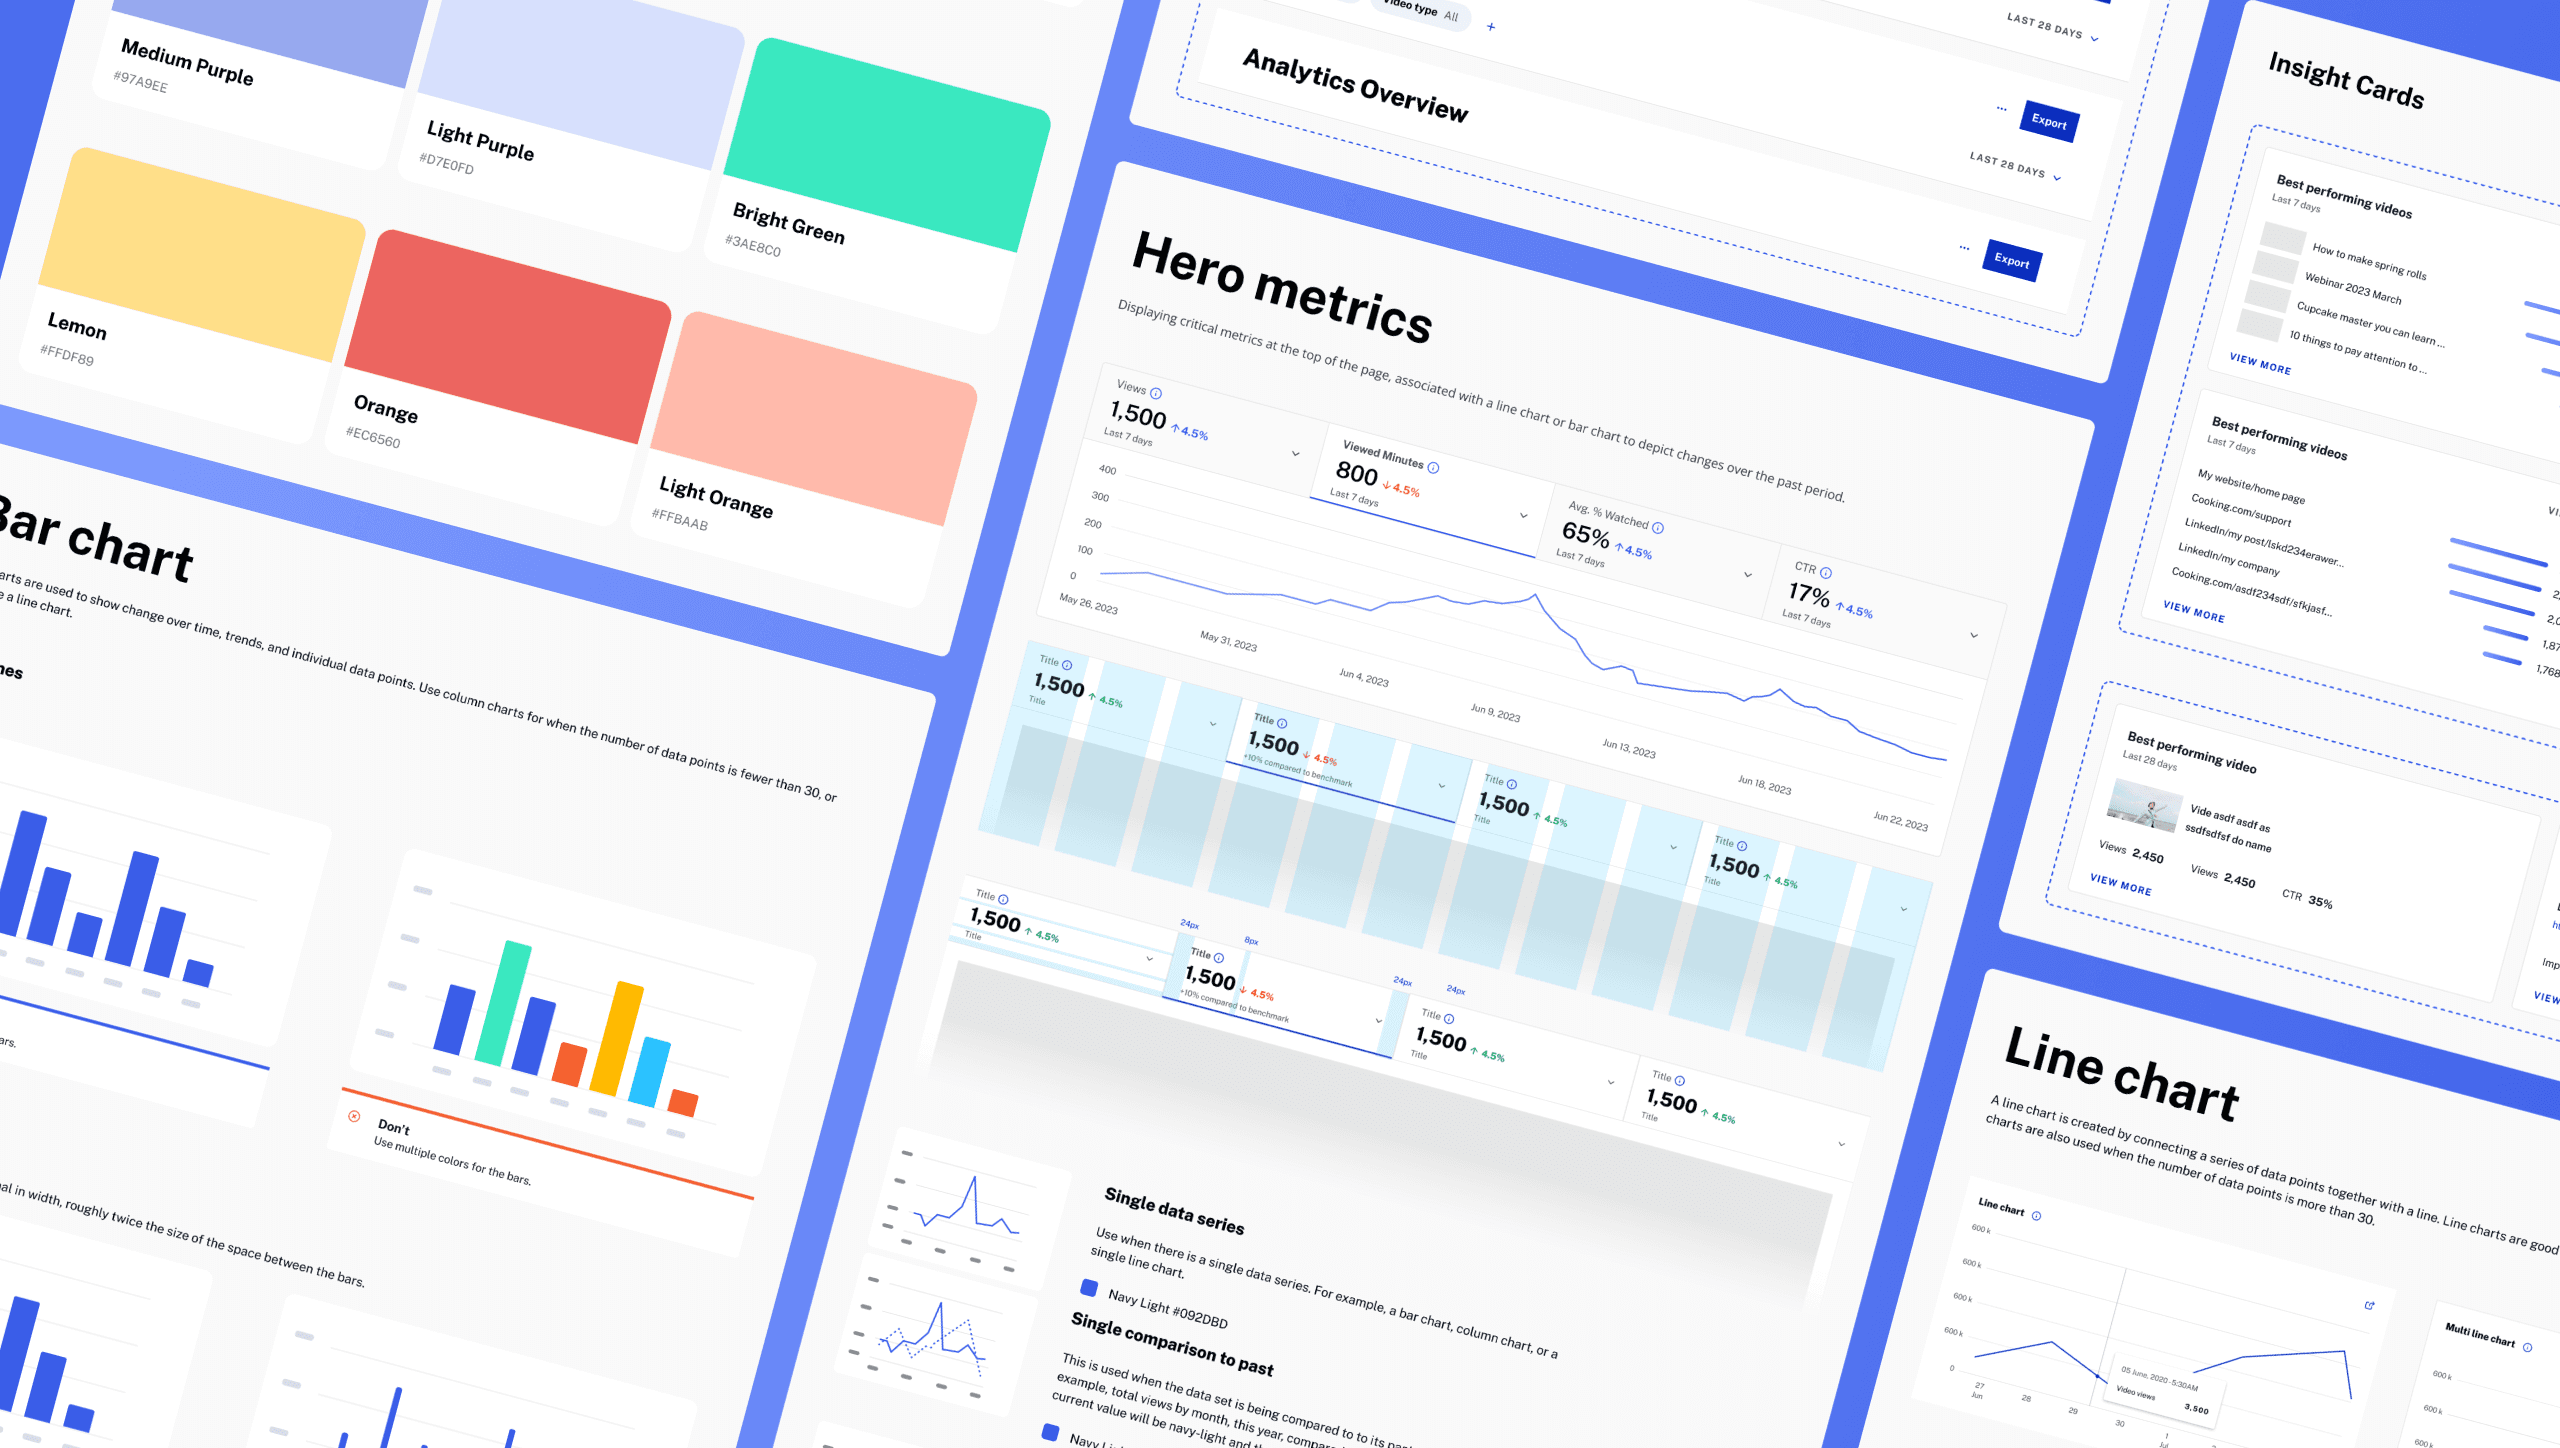
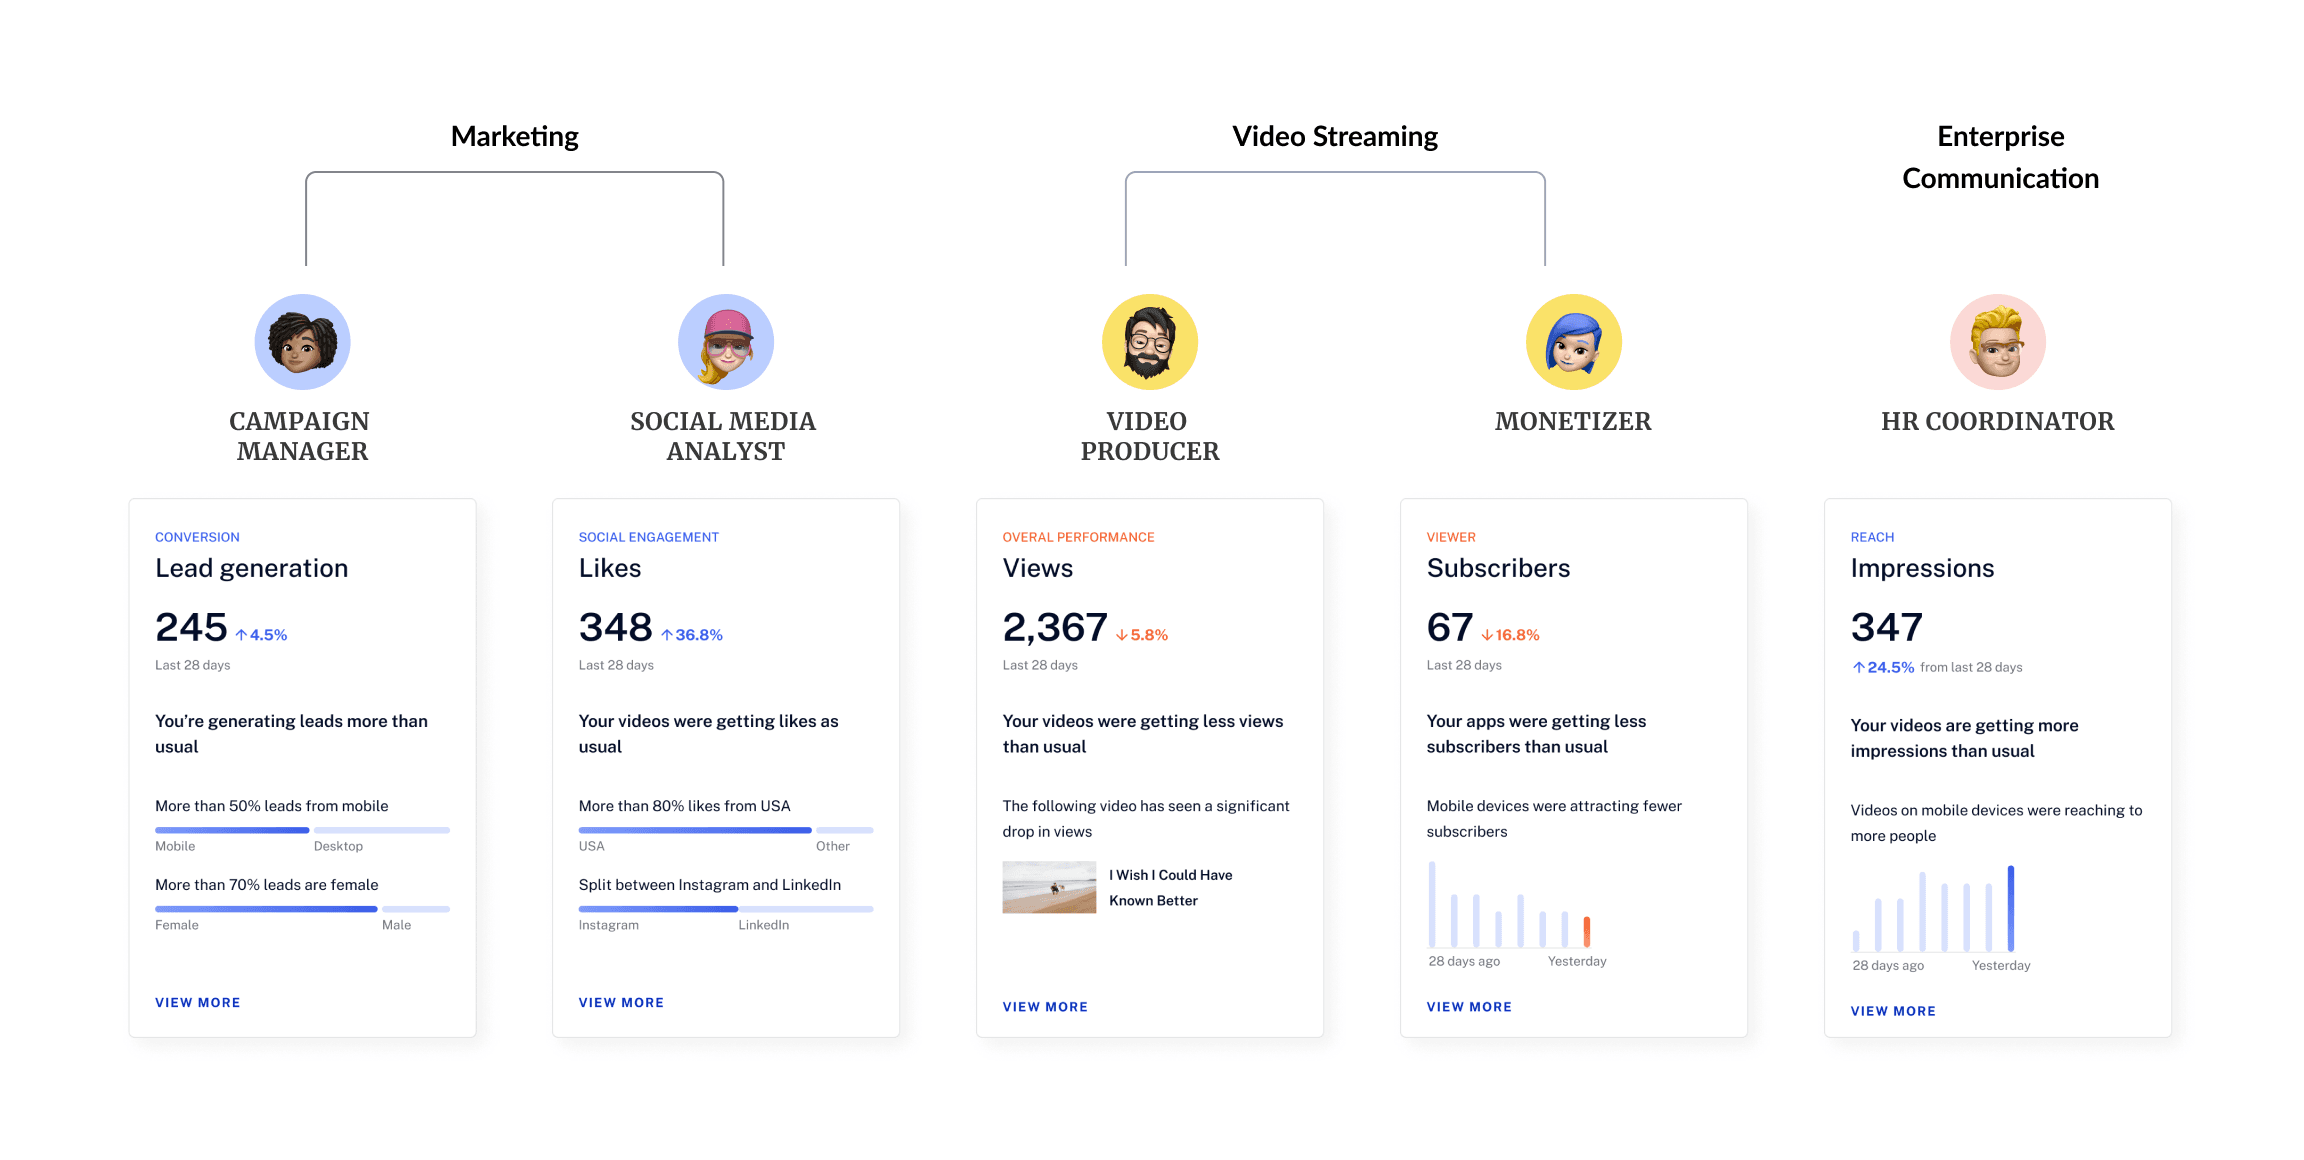
I partnered with a junior designer and ran three rounds of usability testing to combine the new IA and component system into role-based experiences. Testing showed that even people in the same vertical prioritize different metrics, so the system needed a shared structure with tailored starting points.
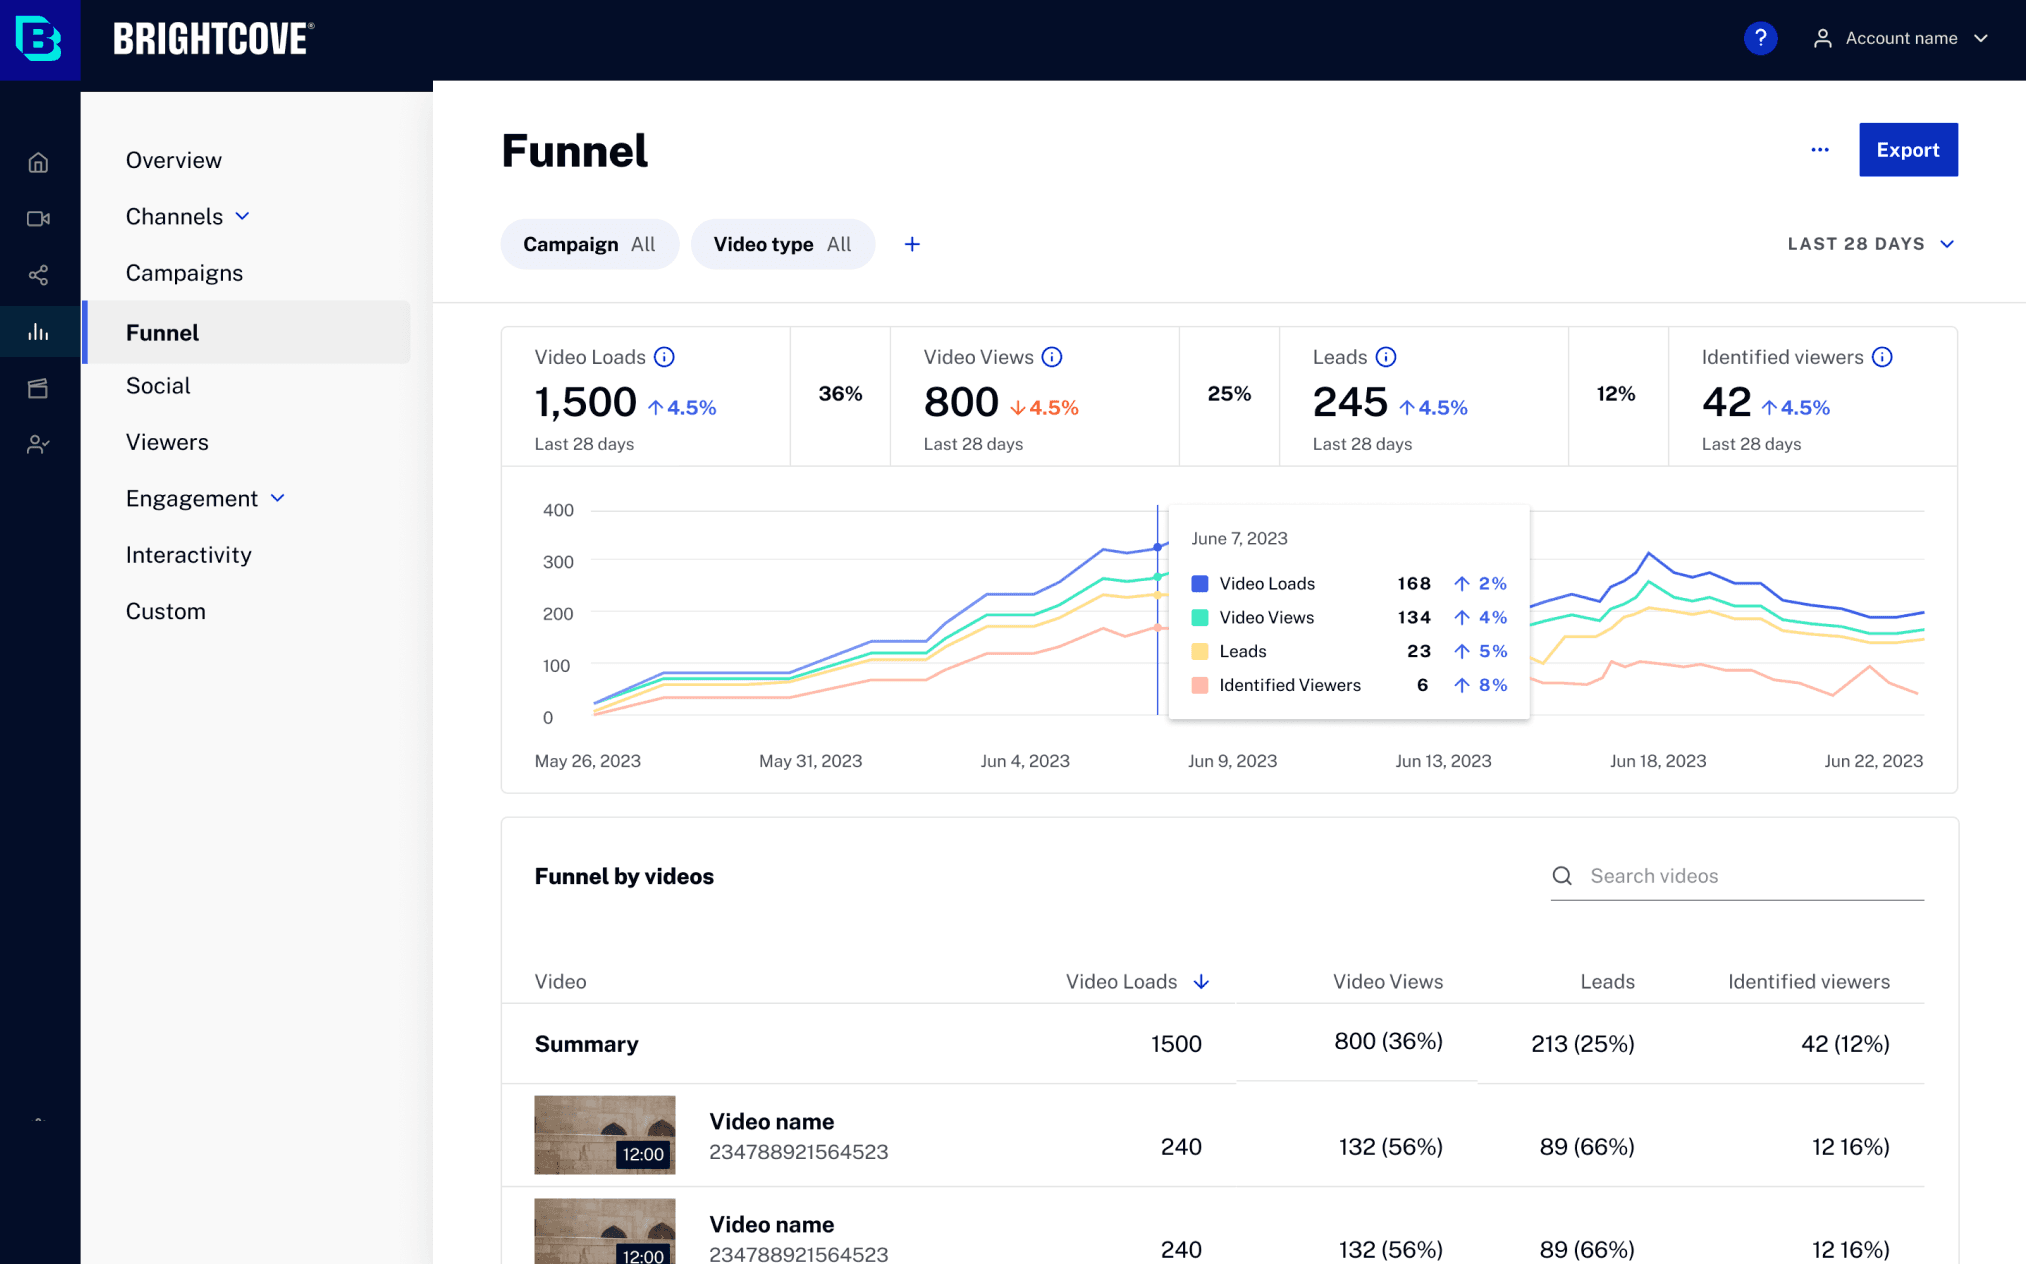
Role: Campaign Manager
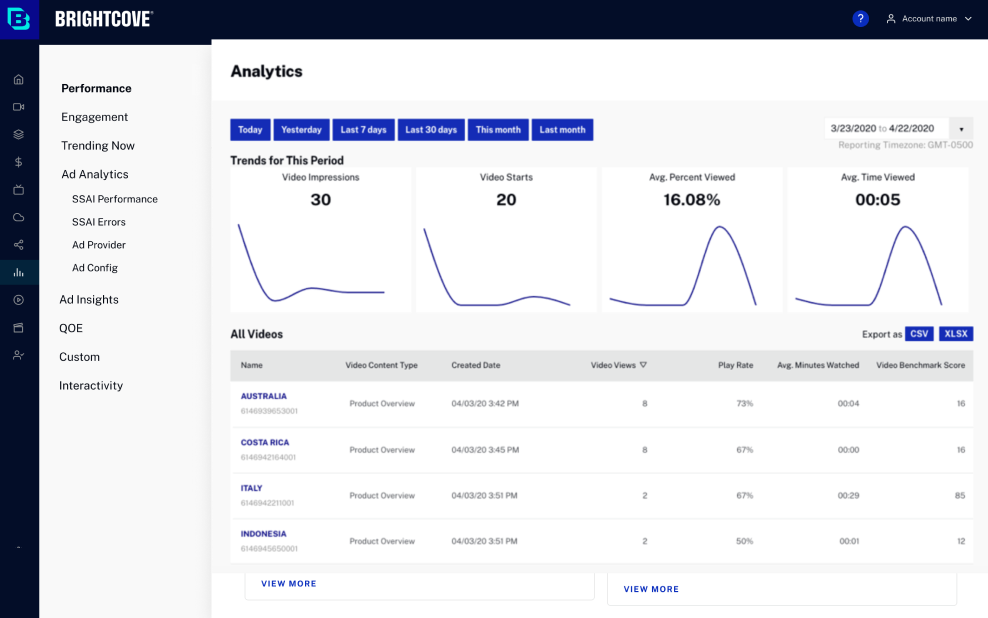
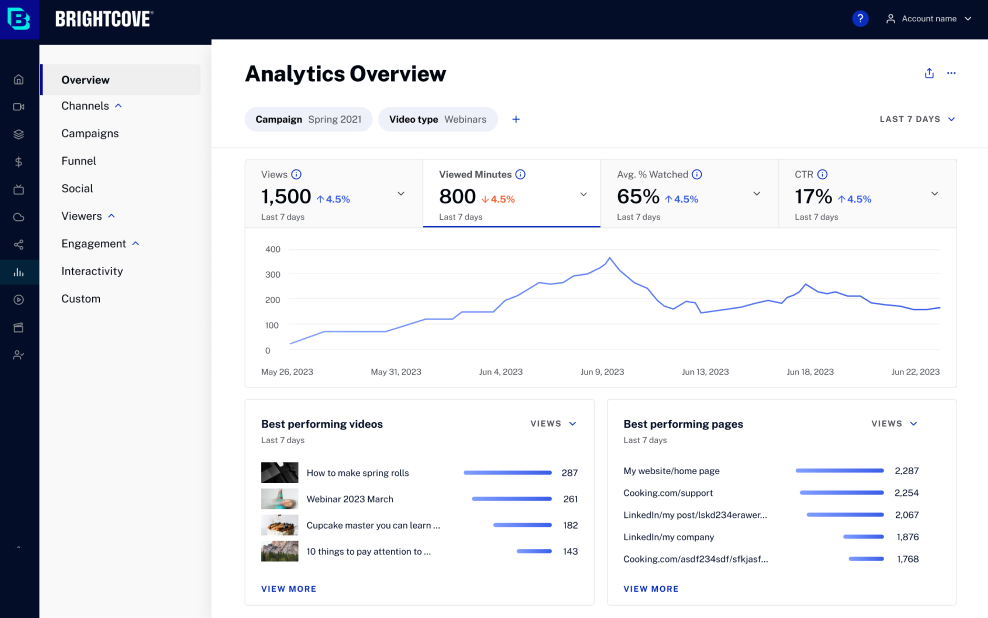
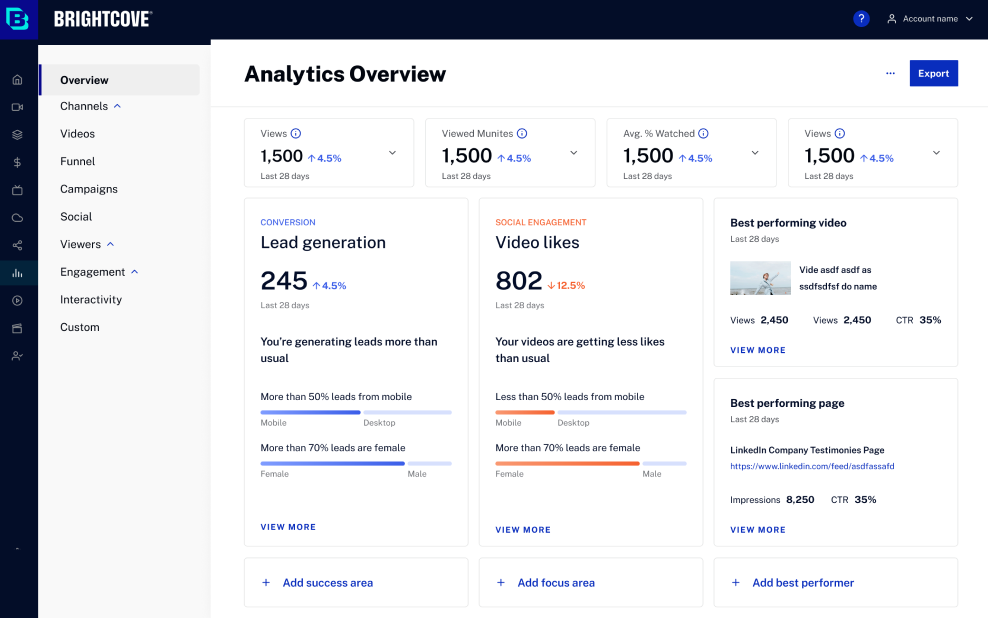
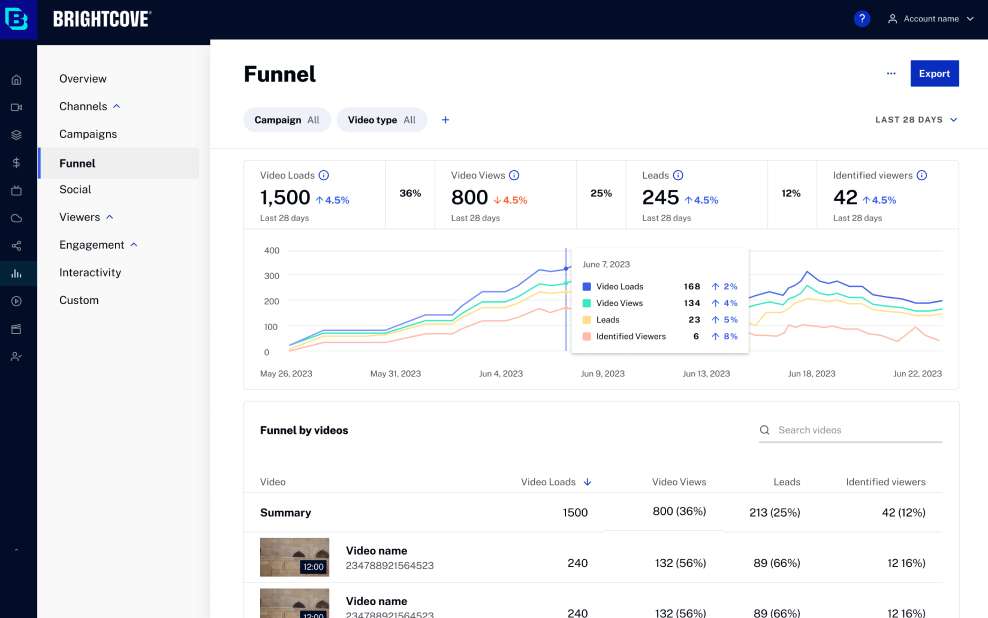
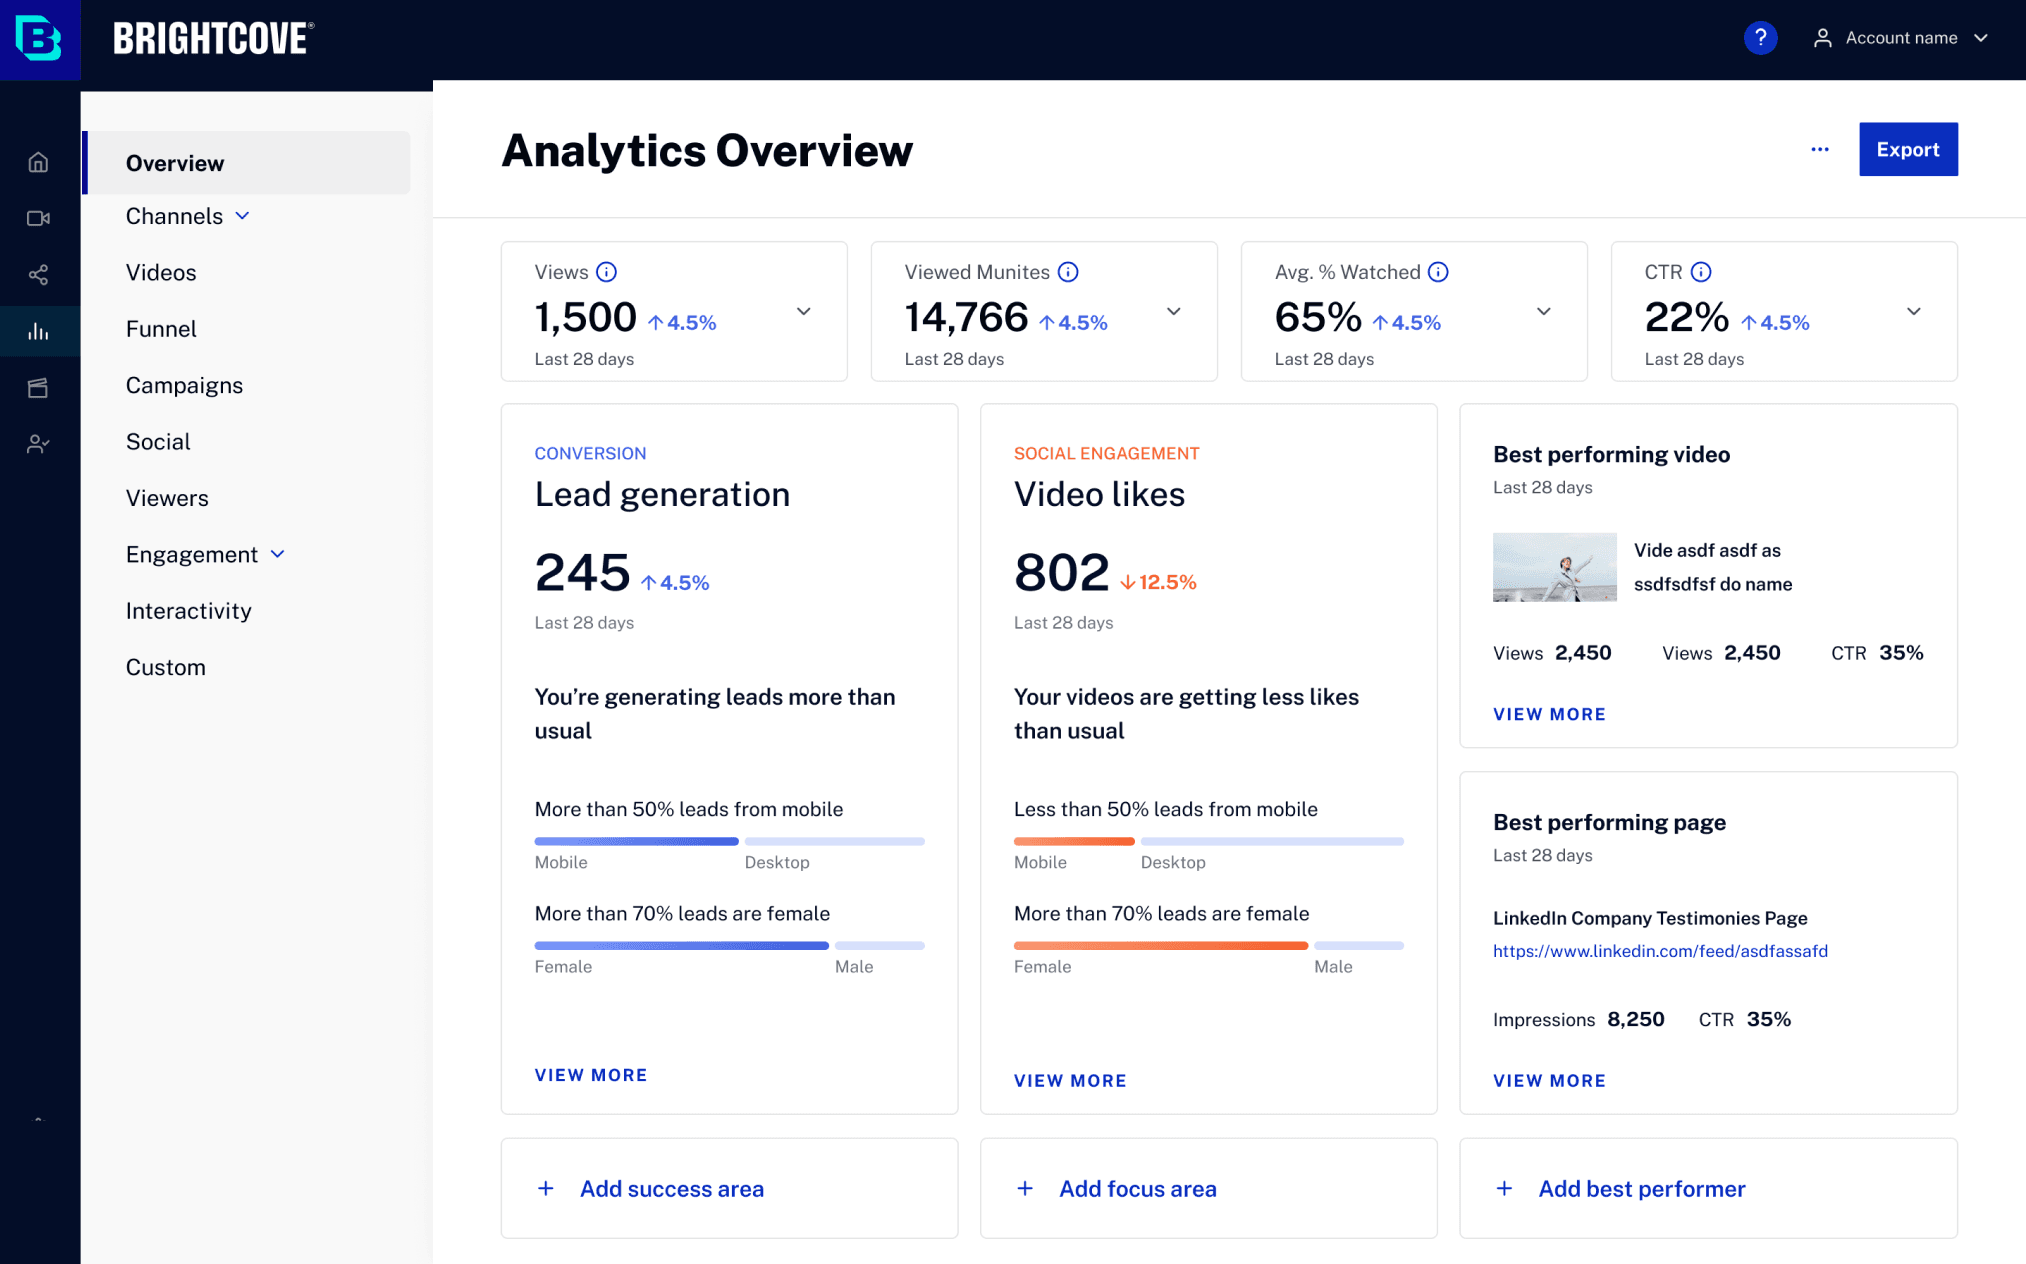
Usability testing revealed that even within the same vertical, people focus on different metrics, further emphasizing the importance of displaying role-based metrics.
 Campaign manager
“The new design instantly showcases my key metrics, highlighting both achievements and concerns, thereby saving significant time. No more sifting through tabs!”
 Campaign manager
“The ‘View More’ feature on the previous page conveniently lets me delve into detailed data, pinpointing the videos driving my lead generation increase. What a timesaver!”
 Video producer
“Now I see my tailored north star metrics - Engagement scores and Returning Viewers - upfront, a refreshing change from the generic version. Plus, I can customize it based on my needs!”
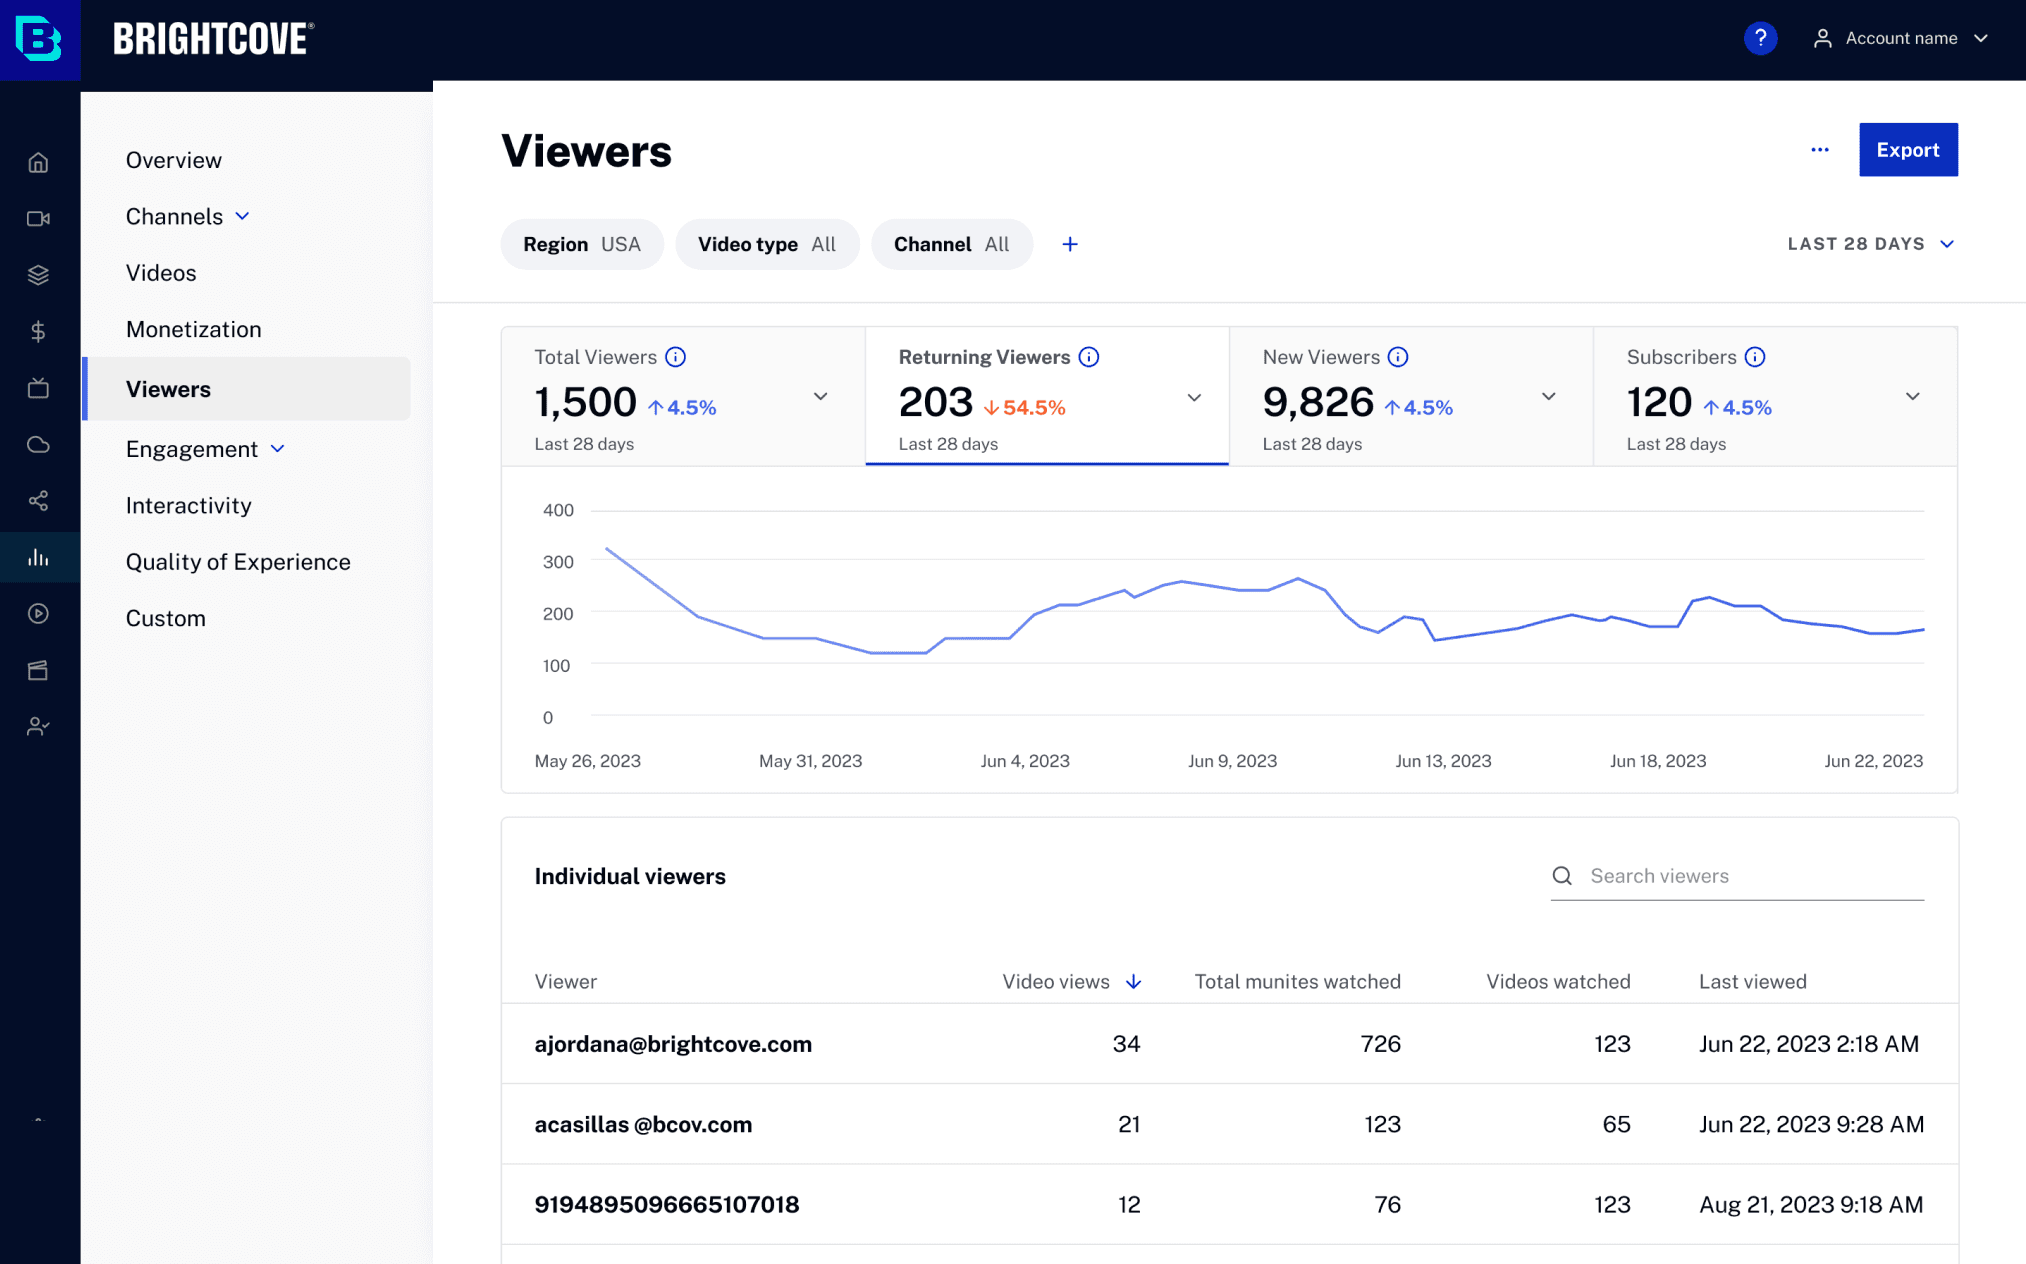
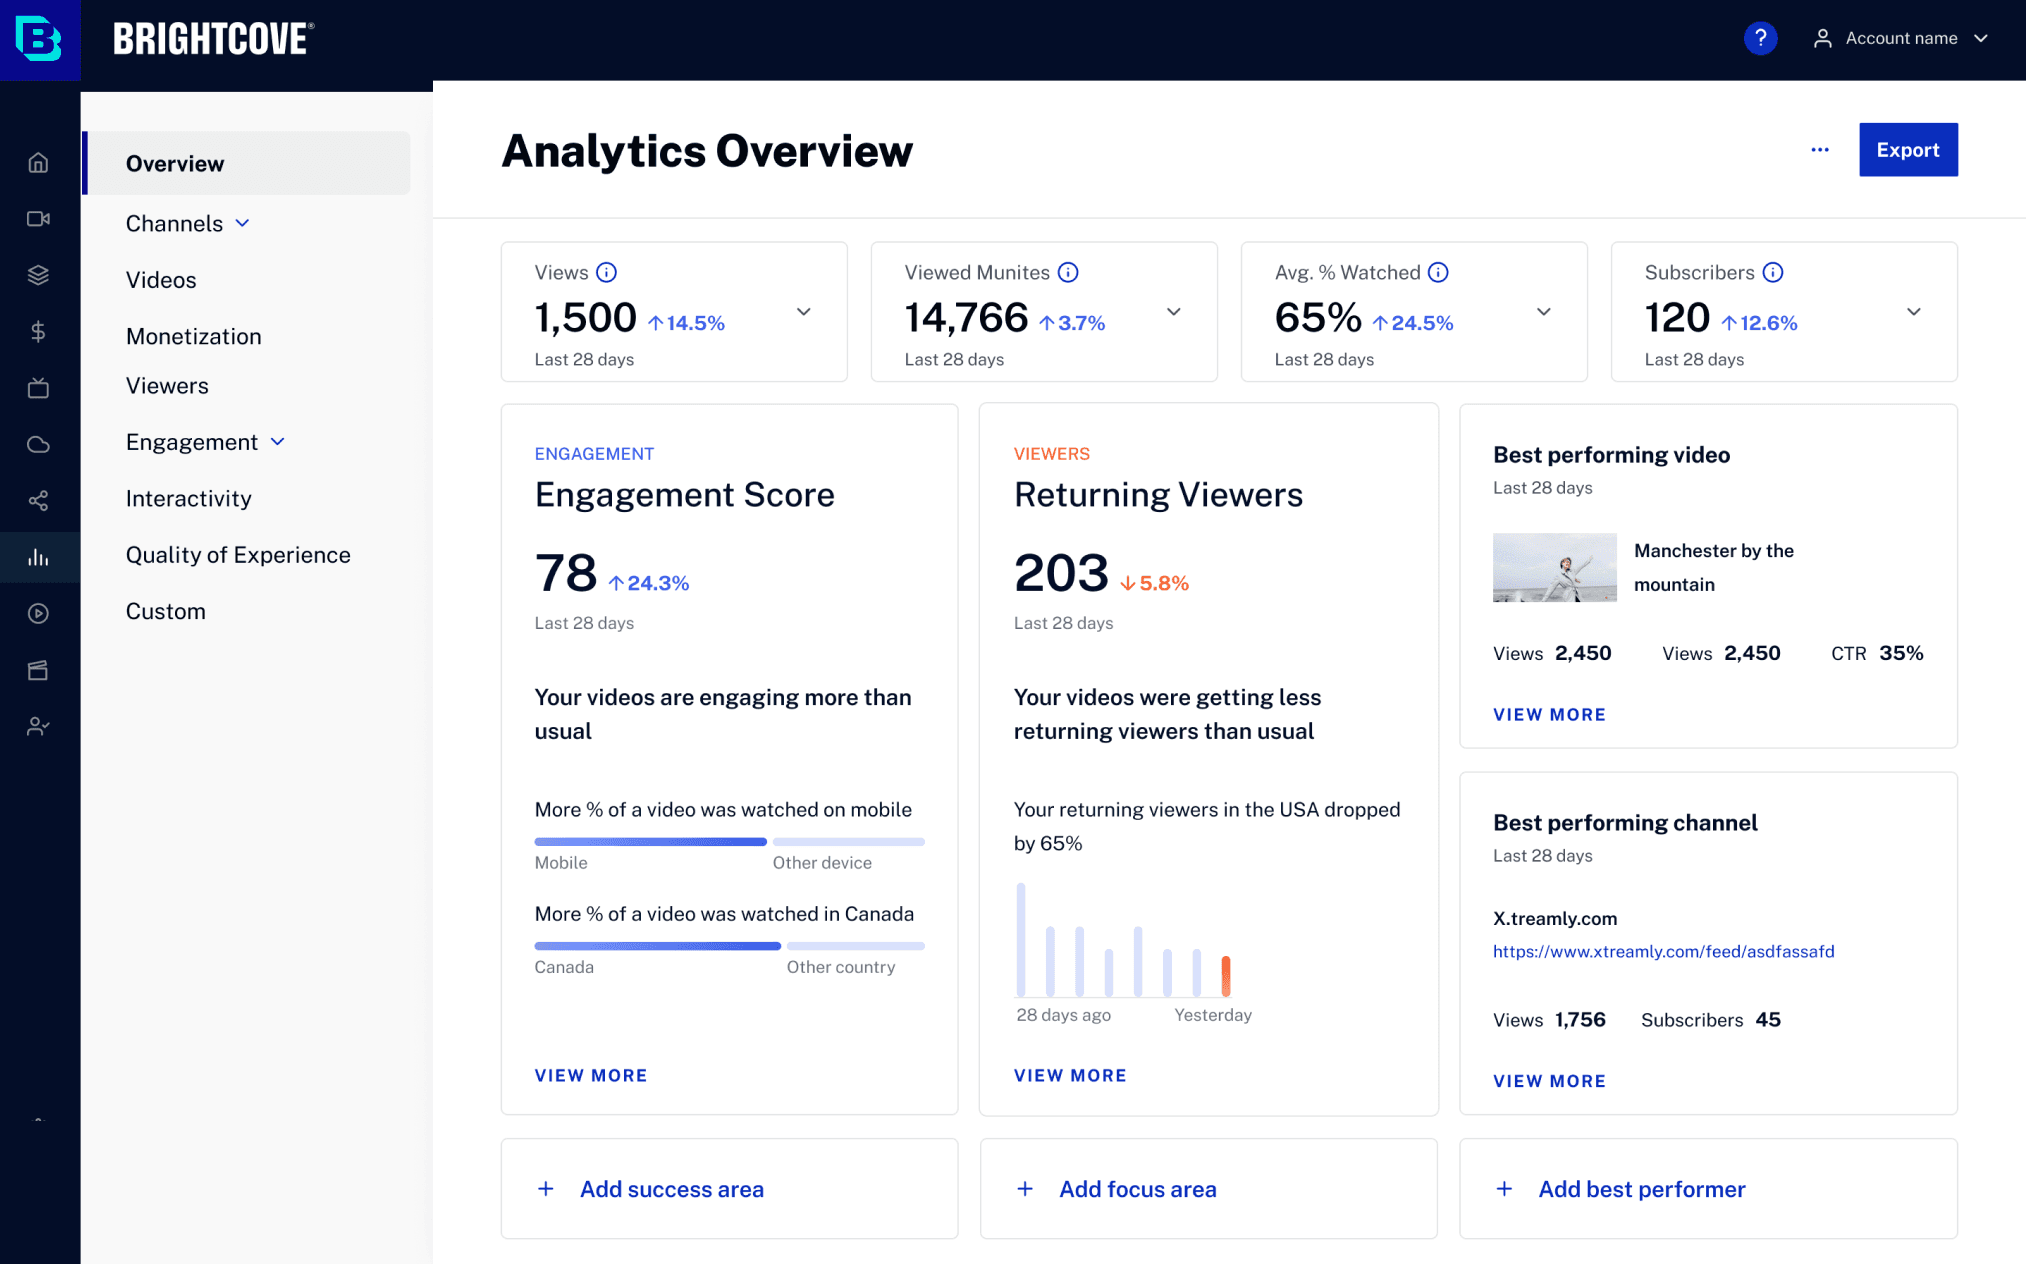 Video producer
“Seeing Returning Viewers drop, I clicked ‘View More’ and drilled down to the viewer’s page, pinpointing when and who contributed to the dip.”
Consistency isn’t making every user follow the same mental model. It’s deciding what should stay invariant—and what should adapt.
Analytics served campaign managers, producers, and other roles with different questions. I initially treated consistency as one shared IA. The stronger system separated invariants—navigation, interaction patterns, and hierarchy—from role-specific starting points and metrics. That made the experience predictable without forcing every user into the same workflow.
